Immigrants from Afghanistan vs Colville No Vehicles in Household
COMPARE
Immigrants from Afghanistan
Colville
No Vehicles in Household
No Vehicles in Household Comparison
Immigrants from Afghanistan
Colville
8.1%
NO VEHICLES IN HOUSEHOLD
99.9/ 100
METRIC RATING
56th/ 347
METRIC RANK
13.7%
NO VEHICLES IN HOUSEHOLD
0.0/ 100
METRIC RATING
286th/ 347
METRIC RANK
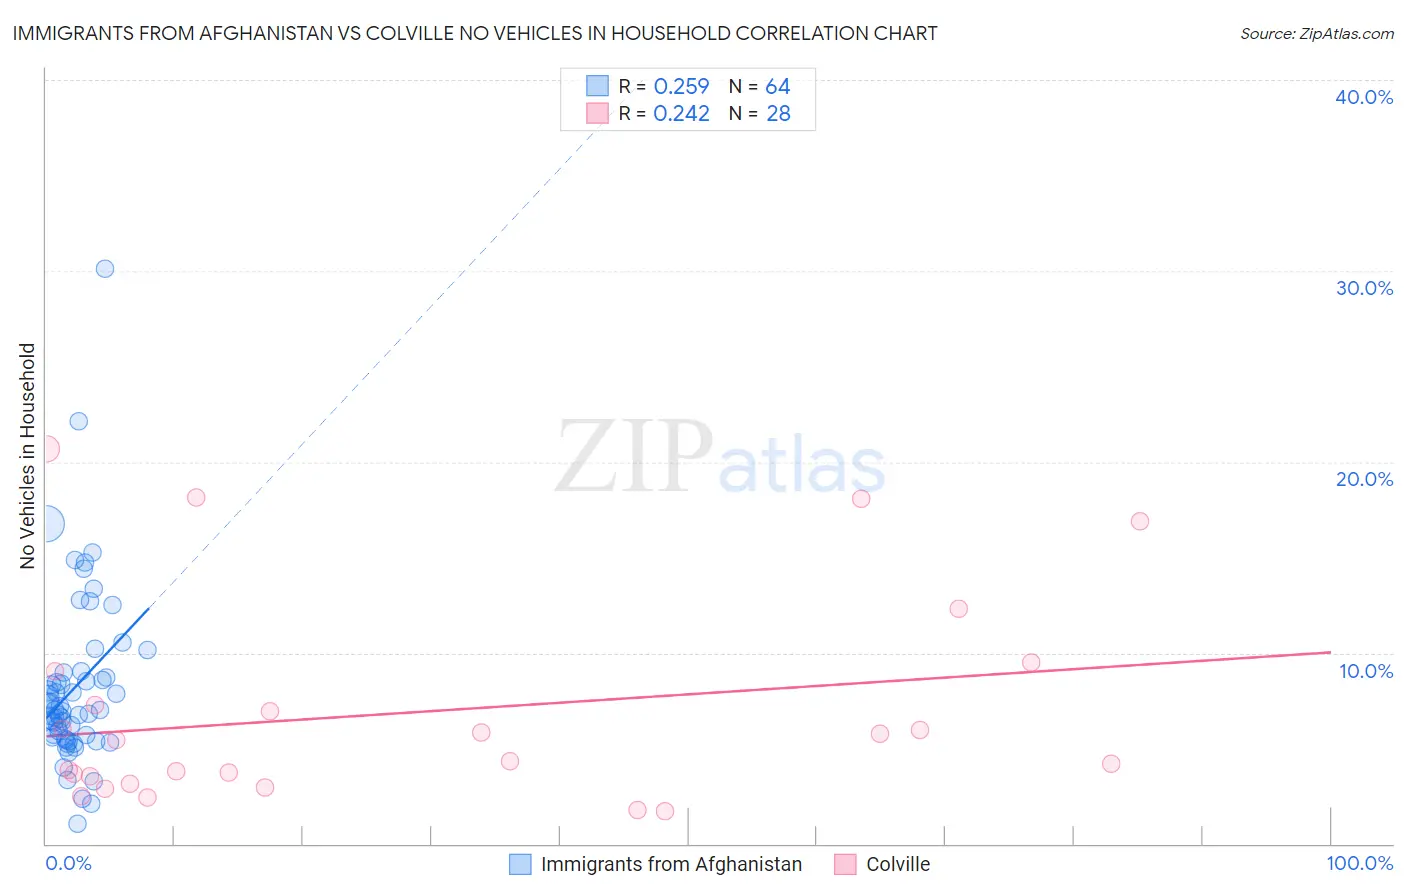
Immigrants from Afghanistan vs Colville No Vehicles in Household Correlation Chart
The statistical analysis conducted on geographies consisting of 147,593,124 people shows a weak positive correlation between the proportion of Immigrants from Afghanistan and percentage of households with no vehicle available in the United States with a correlation coefficient (R) of 0.259 and weighted average of 8.1%. Similarly, the statistical analysis conducted on geographies consisting of 34,652,625 people shows a weak positive correlation between the proportion of Colville and percentage of households with no vehicle available in the United States with a correlation coefficient (R) of 0.242 and weighted average of 13.7%, a difference of 68.9%.
No Vehicles in Household Correlation Summary
| Measurement | Immigrants from Afghanistan | Colville |
| Minimum | 1.1% | 1.7% |
| Maximum | 30.1% | 20.7% |
| Range | 29.0% | 19.0% |
| Mean | 8.2% | 6.9% |
| Median | 7.0% | 4.9% |
| Interquartile 25% (IQ1) | 5.6% | 3.3% |
| Interquartile 75% (IQ3) | 8.8% | 8.2% |
| Interquartile Range (IQR) | 3.3% | 4.8% |
| Standard Deviation (Sample) | 4.7% | 5.4% |
| Standard Deviation (Population) | 4.6% | 5.3% |
Similar Demographics by No Vehicles in Household
Demographics Similar to Immigrants from Afghanistan by No Vehicles in Household
In terms of no vehicles in household, the demographic groups most similar to Immigrants from Afghanistan are Venezuelan (8.1%, a difference of 0.28%), Celtic (8.1%, a difference of 0.39%), Immigrants from Mexico (8.1%, a difference of 0.39%), Immigrants from Venezuela (8.1%, a difference of 0.48%), and Immigrants from India (8.2%, a difference of 0.74%).
| Demographics | Rating | Rank | No Vehicles in Household |
| Guamanians/Chamorros | 99.9 /100 | #49 | Exceptional 8.0% |
| Belgians | 99.9 /100 | #50 | Exceptional 8.0% |
| Koreans | 99.9 /100 | #51 | Exceptional 8.0% |
| Hawaiians | 99.9 /100 | #52 | Exceptional 8.0% |
| Slovenes | 99.9 /100 | #53 | Exceptional 8.0% |
| Immigrants | Venezuela | 99.9 /100 | #54 | Exceptional 8.1% |
| Celtics | 99.9 /100 | #55 | Exceptional 8.1% |
| Immigrants | Afghanistan | 99.9 /100 | #56 | Exceptional 8.1% |
| Venezuelans | 99.8 /100 | #57 | Exceptional 8.1% |
| Immigrants | Mexico | 99.8 /100 | #58 | Exceptional 8.1% |
| Immigrants | India | 99.8 /100 | #59 | Exceptional 8.2% |
| Immigrants | Laos | 99.8 /100 | #60 | Exceptional 8.2% |
| Thais | 99.8 /100 | #61 | Exceptional 8.2% |
| Chinese | 99.8 /100 | #62 | Exceptional 8.2% |
| Slovaks | 99.8 /100 | #63 | Exceptional 8.3% |
Demographics Similar to Colville by No Vehicles in Household
In terms of no vehicles in household, the demographic groups most similar to Colville are Immigrants from Ireland (13.7%, a difference of 0.21%), Hopi (13.7%, a difference of 0.35%), Immigrants from Eastern Europe (13.6%, a difference of 0.66%), Immigrants from Malaysia (13.6%, a difference of 0.71%), and Immigrants from Kazakhstan (13.6%, a difference of 0.96%).
| Demographics | Rating | Rank | No Vehicles in Household |
| Mongolians | 0.0 /100 | #279 | Tragic 13.1% |
| Alsatians | 0.0 /100 | #280 | Tragic 13.2% |
| Central American Indians | 0.0 /100 | #281 | Tragic 13.3% |
| Immigrants | Eastern Asia | 0.0 /100 | #282 | Tragic 13.5% |
| Immigrants | Kazakhstan | 0.0 /100 | #283 | Tragic 13.6% |
| Immigrants | Malaysia | 0.0 /100 | #284 | Tragic 13.6% |
| Immigrants | Eastern Europe | 0.0 /100 | #285 | Tragic 13.6% |
| Colville | 0.0 /100 | #286 | Tragic 13.7% |
| Immigrants | Ireland | 0.0 /100 | #287 | Tragic 13.7% |
| Hopi | 0.0 /100 | #288 | Tragic 13.7% |
| Immigrants | Australia | 0.0 /100 | #289 | Tragic 13.8% |
| Indians (Asian) | 0.0 /100 | #290 | Tragic 14.1% |
| Okinawans | 0.0 /100 | #291 | Tragic 14.1% |
| Pima | 0.0 /100 | #292 | Tragic 14.1% |
| Immigrants | Jamaica | 0.0 /100 | #293 | Tragic 14.2% |