Immigrants from Afghanistan vs Iraqi No Vehicles in Household
COMPARE
Immigrants from Afghanistan
Iraqi
No Vehicles in Household
No Vehicles in Household Comparison
Immigrants from Afghanistan
Iraqis
8.1%
NO VEHICLES IN HOUSEHOLD
99.9/ 100
METRIC RATING
56th/ 347
METRIC RANK
7.7%
NO VEHICLES IN HOUSEHOLD
99.9/ 100
METRIC RATING
36th/ 347
METRIC RANK
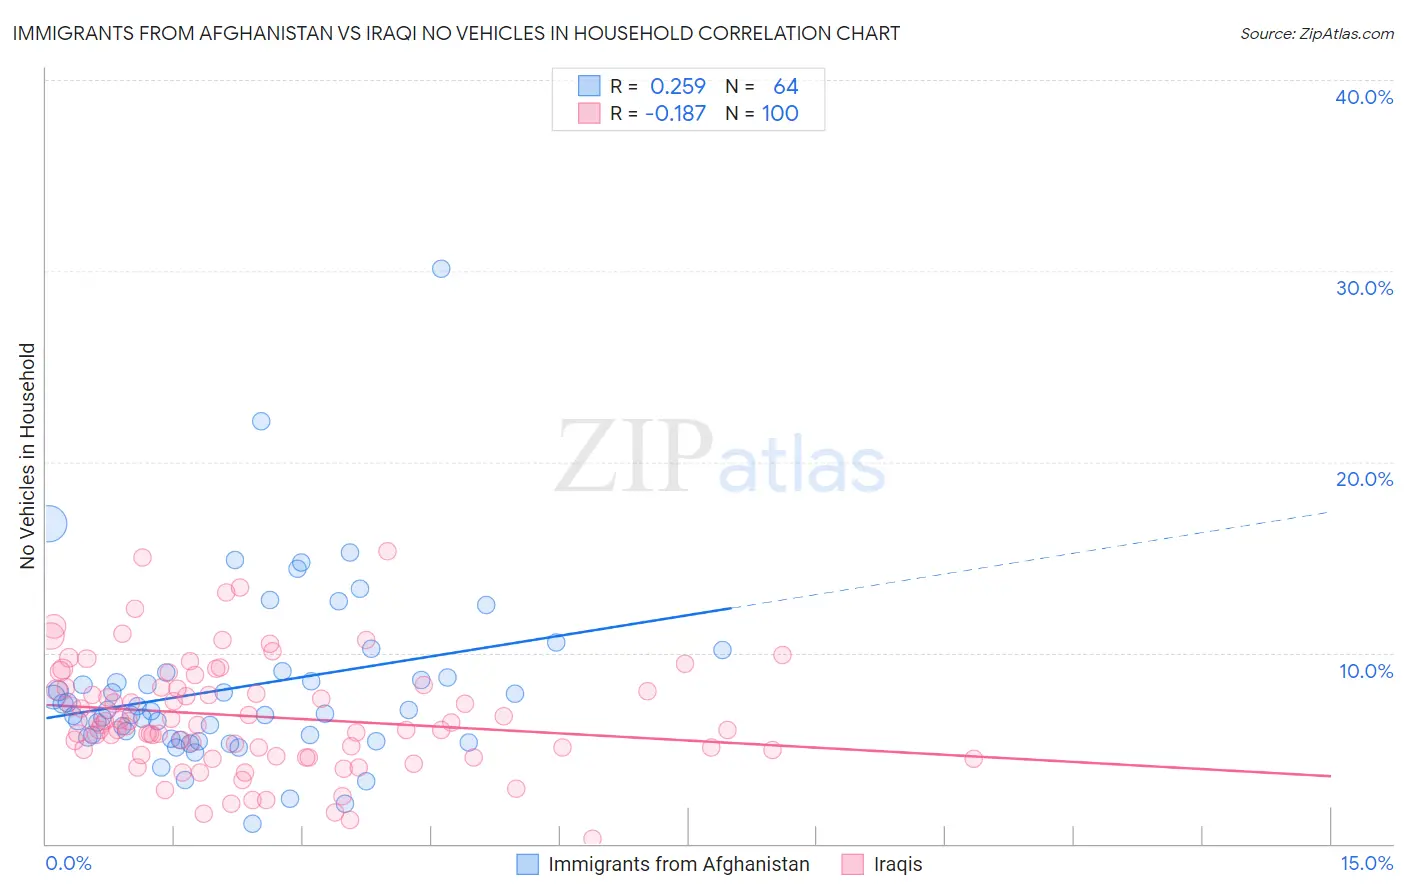
Immigrants from Afghanistan vs Iraqi No Vehicles in Household Correlation Chart
The statistical analysis conducted on geographies consisting of 147,593,124 people shows a weak positive correlation between the proportion of Immigrants from Afghanistan and percentage of households with no vehicle available in the United States with a correlation coefficient (R) of 0.259 and weighted average of 8.1%. Similarly, the statistical analysis conducted on geographies consisting of 116,437,877 people shows a poor negative correlation between the proportion of Iraqis and percentage of households with no vehicle available in the United States with a correlation coefficient (R) of -0.187 and weighted average of 7.7%, a difference of 4.6%.
No Vehicles in Household Correlation Summary
| Measurement | Immigrants from Afghanistan | Iraqi |
| Minimum | 1.1% | 0.29% |
| Maximum | 30.1% | 15.3% |
| Range | 29.0% | 15.0% |
| Mean | 8.2% | 6.7% |
| Median | 7.0% | 6.2% |
| Interquartile 25% (IQ1) | 5.6% | 4.8% |
| Interquartile 75% (IQ3) | 8.8% | 8.2% |
| Interquartile Range (IQR) | 3.3% | 3.4% |
| Standard Deviation (Sample) | 4.7% | 2.9% |
| Standard Deviation (Population) | 4.6% | 2.9% |
Demographics Similar to Immigrants from Afghanistan and Iraqis by No Vehicles in Household
In terms of no vehicles in household, the demographic groups most similar to Immigrants from Afghanistan are Celtic (8.1%, a difference of 0.39%), Immigrants from Venezuela (8.1%, a difference of 0.48%), Hawaiian (8.0%, a difference of 0.79%), Slovene (8.0%, a difference of 0.79%), and Korean (8.0%, a difference of 1.4%). Similarly, the demographic groups most similar to Iraqis are Basque (7.8%, a difference of 0.25%), Creek (7.8%, a difference of 0.39%), Immigrants from Fiji (7.8%, a difference of 0.97%), Czechoslovakian (7.8%, a difference of 1.1%), and French Canadian (7.8%, a difference of 1.2%).
| Demographics | Rating | Rank | No Vehicles in Household |
| Iraqis | 99.9 /100 | #36 | Exceptional 7.7% |
| Basques | 99.9 /100 | #37 | Exceptional 7.8% |
| Creek | 99.9 /100 | #38 | Exceptional 7.8% |
| Immigrants | Fiji | 99.9 /100 | #39 | Exceptional 7.8% |
| Czechoslovakians | 99.9 /100 | #40 | Exceptional 7.8% |
| French Canadians | 99.9 /100 | #41 | Exceptional 7.8% |
| Swiss | 99.9 /100 | #42 | Exceptional 7.9% |
| Chickasaw | 99.9 /100 | #43 | Exceptional 7.9% |
| Choctaw | 99.9 /100 | #44 | Exceptional 7.9% |
| Immigrants | Nonimmigrants | 99.9 /100 | #45 | Exceptional 7.9% |
| Spanish | 99.9 /100 | #46 | Exceptional 7.9% |
| Northern Europeans | 99.9 /100 | #47 | Exceptional 7.9% |
| Afghans | 99.9 /100 | #48 | Exceptional 8.0% |
| Guamanians/Chamorros | 99.9 /100 | #49 | Exceptional 8.0% |
| Belgians | 99.9 /100 | #50 | Exceptional 8.0% |
| Koreans | 99.9 /100 | #51 | Exceptional 8.0% |
| Hawaiians | 99.9 /100 | #52 | Exceptional 8.0% |
| Slovenes | 99.9 /100 | #53 | Exceptional 8.0% |
| Immigrants | Venezuela | 99.9 /100 | #54 | Exceptional 8.1% |
| Celtics | 99.9 /100 | #55 | Exceptional 8.1% |
| Immigrants | Afghanistan | 99.9 /100 | #56 | Exceptional 8.1% |