Immigrants from Afghanistan vs Laotian No Vehicles in Household
COMPARE
Immigrants from Afghanistan
Laotian
No Vehicles in Household
No Vehicles in Household Comparison
Immigrants from Afghanistan
Laotians
8.1%
NO VEHICLES IN HOUSEHOLD
99.9/ 100
METRIC RATING
56th/ 347
METRIC RANK
9.1%
NO VEHICLES IN HOUSEHOLD
97.8/ 100
METRIC RATING
106th/ 347
METRIC RANK
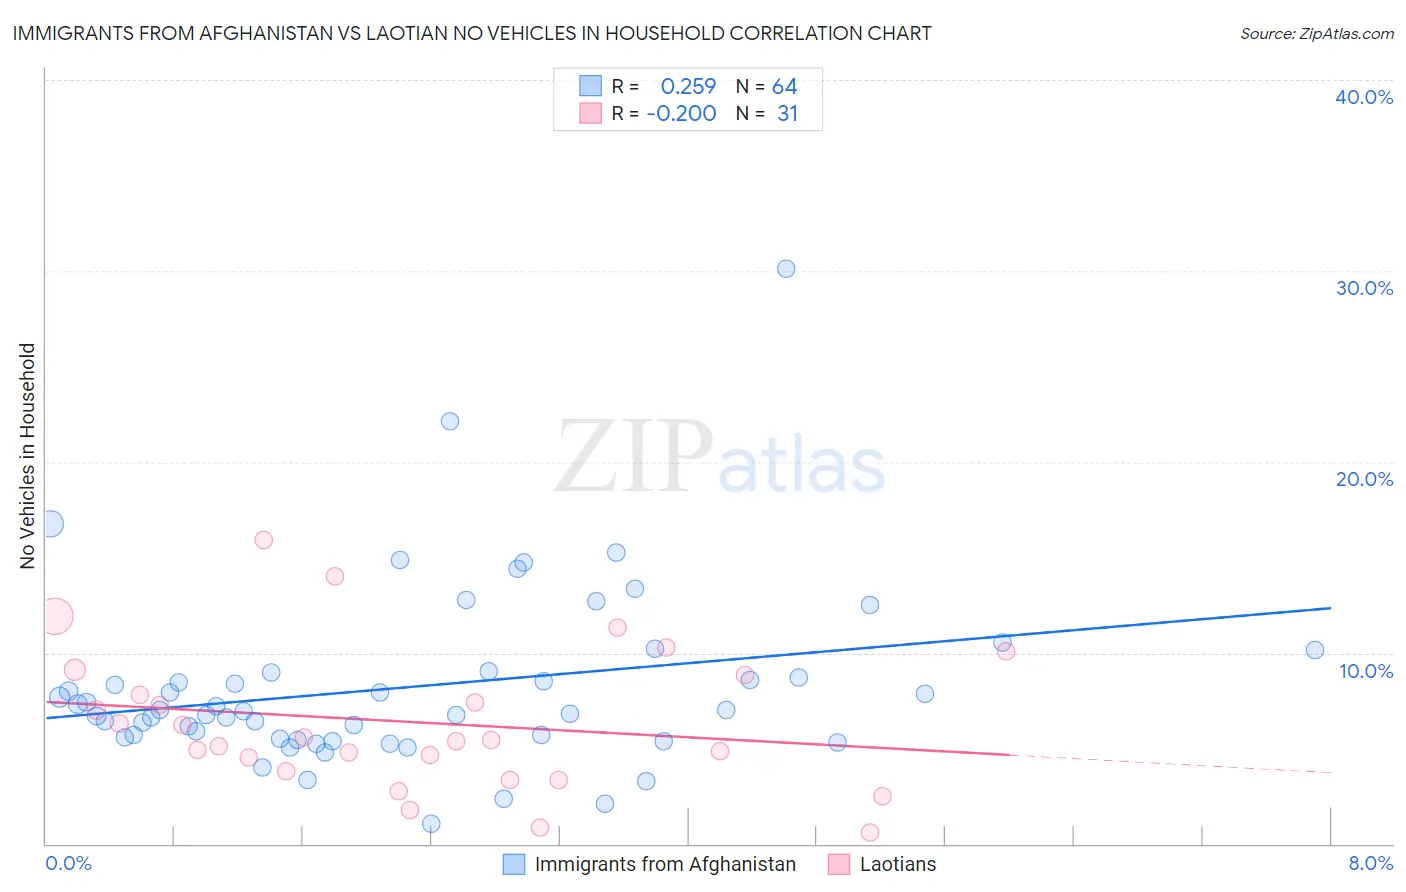
Immigrants from Afghanistan vs Laotian No Vehicles in Household Correlation Chart
The statistical analysis conducted on geographies consisting of 147,593,124 people shows a weak positive correlation between the proportion of Immigrants from Afghanistan and percentage of households with no vehicle available in the United States with a correlation coefficient (R) of 0.259 and weighted average of 8.1%. Similarly, the statistical analysis conducted on geographies consisting of 224,346,725 people shows a poor negative correlation between the proportion of Laotians and percentage of households with no vehicle available in the United States with a correlation coefficient (R) of -0.200 and weighted average of 9.1%, a difference of 11.8%.
No Vehicles in Household Correlation Summary
| Measurement | Immigrants from Afghanistan | Laotian |
| Minimum | 1.1% | 0.59% |
| Maximum | 30.1% | 15.9% |
| Range | 29.0% | 15.3% |
| Mean | 8.2% | 6.4% |
| Median | 7.0% | 5.4% |
| Interquartile 25% (IQ1) | 5.6% | 3.8% |
| Interquartile 75% (IQ3) | 8.8% | 8.9% |
| Interquartile Range (IQR) | 3.3% | 5.0% |
| Standard Deviation (Sample) | 4.7% | 3.7% |
| Standard Deviation (Population) | 4.6% | 3.6% |
Similar Demographics by No Vehicles in Household
Demographics Similar to Immigrants from Afghanistan by No Vehicles in Household
In terms of no vehicles in household, the demographic groups most similar to Immigrants from Afghanistan are Venezuelan (8.1%, a difference of 0.28%), Celtic (8.1%, a difference of 0.39%), Immigrants from Mexico (8.1%, a difference of 0.39%), Immigrants from Venezuela (8.1%, a difference of 0.48%), and Immigrants from India (8.2%, a difference of 0.74%).
| Demographics | Rating | Rank | No Vehicles in Household |
| Guamanians/Chamorros | 99.9 /100 | #49 | Exceptional 8.0% |
| Belgians | 99.9 /100 | #50 | Exceptional 8.0% |
| Koreans | 99.9 /100 | #51 | Exceptional 8.0% |
| Hawaiians | 99.9 /100 | #52 | Exceptional 8.0% |
| Slovenes | 99.9 /100 | #53 | Exceptional 8.0% |
| Immigrants | Venezuela | 99.9 /100 | #54 | Exceptional 8.1% |
| Celtics | 99.9 /100 | #55 | Exceptional 8.1% |
| Immigrants | Afghanistan | 99.9 /100 | #56 | Exceptional 8.1% |
| Venezuelans | 99.8 /100 | #57 | Exceptional 8.1% |
| Immigrants | Mexico | 99.8 /100 | #58 | Exceptional 8.1% |
| Immigrants | India | 99.8 /100 | #59 | Exceptional 8.2% |
| Immigrants | Laos | 99.8 /100 | #60 | Exceptional 8.2% |
| Thais | 99.8 /100 | #61 | Exceptional 8.2% |
| Chinese | 99.8 /100 | #62 | Exceptional 8.2% |
| Slovaks | 99.8 /100 | #63 | Exceptional 8.3% |
Demographics Similar to Laotians by No Vehicles in Household
In terms of no vehicles in household, the demographic groups most similar to Laotians are Spanish American (9.1%, a difference of 0.090%), Zimbabwean (9.0%, a difference of 0.25%), Hispanic or Latino (9.1%, a difference of 0.26%), Mexican American Indian (9.1%, a difference of 0.35%), and Maltese (9.1%, a difference of 0.48%).
| Demographics | Rating | Rank | No Vehicles in Household |
| Bulgarians | 98.4 /100 | #99 | Exceptional 9.0% |
| Asians | 98.3 /100 | #100 | Exceptional 9.0% |
| Pakistanis | 98.3 /100 | #101 | Exceptional 9.0% |
| Yugoslavians | 98.3 /100 | #102 | Exceptional 9.0% |
| Seminole | 98.3 /100 | #103 | Exceptional 9.0% |
| Zimbabweans | 98.0 /100 | #104 | Exceptional 9.0% |
| Spanish Americans | 97.9 /100 | #105 | Exceptional 9.1% |
| Laotians | 97.8 /100 | #106 | Exceptional 9.1% |
| Hispanics or Latinos | 97.7 /100 | #107 | Exceptional 9.1% |
| Mexican American Indians | 97.6 /100 | #108 | Exceptional 9.1% |
| Maltese | 97.6 /100 | #109 | Exceptional 9.1% |
| Delaware | 97.2 /100 | #110 | Exceptional 9.2% |
| Immigrants | Kuwait | 95.1 /100 | #111 | Exceptional 9.4% |
| Armenians | 95.0 /100 | #112 | Exceptional 9.4% |
| Immigrants | Netherlands | 94.8 /100 | #113 | Exceptional 9.4% |