Immigrants from Afghanistan vs Immigrants from Bangladesh No Vehicles in Household
COMPARE
Immigrants from Afghanistan
Immigrants from Bangladesh
No Vehicles in Household
No Vehicles in Household Comparison
Immigrants from Afghanistan
Immigrants from Bangladesh
8.1%
NO VEHICLES IN HOUSEHOLD
99.9/ 100
METRIC RATING
56th/ 347
METRIC RANK
25.8%
NO VEHICLES IN HOUSEHOLD
0.0/ 100
METRIC RATING
334th/ 347
METRIC RANK
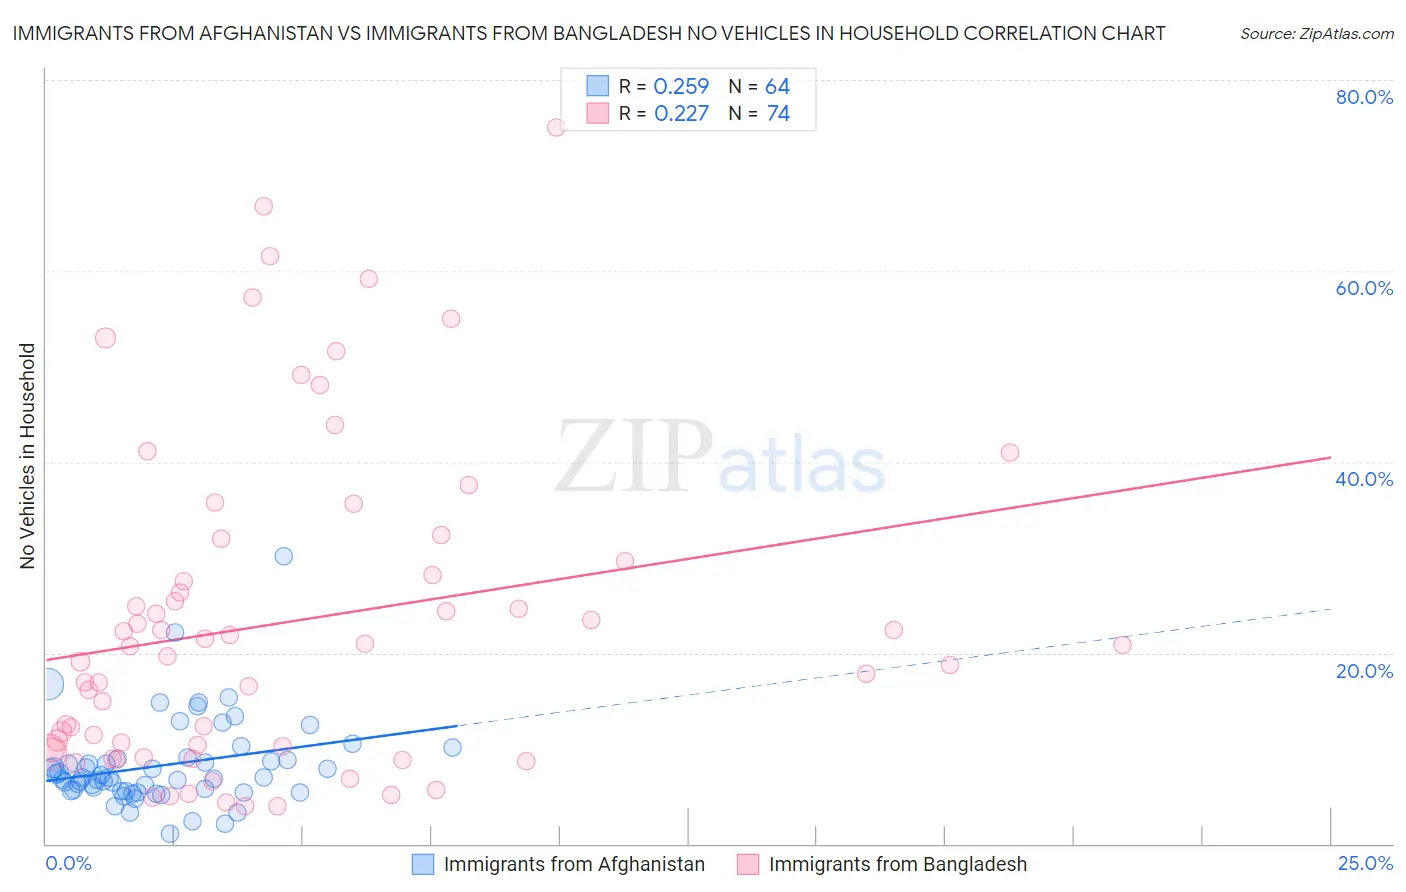
Immigrants from Afghanistan vs Immigrants from Bangladesh No Vehicles in Household Correlation Chart
The statistical analysis conducted on geographies consisting of 147,593,124 people shows a weak positive correlation between the proportion of Immigrants from Afghanistan and percentage of households with no vehicle available in the United States with a correlation coefficient (R) of 0.259 and weighted average of 8.1%. Similarly, the statistical analysis conducted on geographies consisting of 203,492,873 people shows a weak positive correlation between the proportion of Immigrants from Bangladesh and percentage of households with no vehicle available in the United States with a correlation coefficient (R) of 0.227 and weighted average of 25.8%, a difference of 217.7%.
No Vehicles in Household Correlation Summary
| Measurement | Immigrants from Afghanistan | Immigrants from Bangladesh |
| Minimum | 1.1% | 3.9% |
| Maximum | 30.1% | 75.0% |
| Range | 29.0% | 71.1% |
| Mean | 8.2% | 23.3% |
| Median | 7.0% | 20.2% |
| Interquartile 25% (IQ1) | 5.6% | 9.9% |
| Interquartile 75% (IQ3) | 8.8% | 29.6% |
| Interquartile Range (IQR) | 3.3% | 19.7% |
| Standard Deviation (Sample) | 4.7% | 17.0% |
| Standard Deviation (Population) | 4.6% | 16.9% |
Similar Demographics by No Vehicles in Household
Demographics Similar to Immigrants from Afghanistan by No Vehicles in Household
In terms of no vehicles in household, the demographic groups most similar to Immigrants from Afghanistan are Venezuelan (8.1%, a difference of 0.28%), Celtic (8.1%, a difference of 0.39%), Immigrants from Mexico (8.1%, a difference of 0.39%), Immigrants from Venezuela (8.1%, a difference of 0.48%), and Immigrants from India (8.2%, a difference of 0.74%).
| Demographics | Rating | Rank | No Vehicles in Household |
| Guamanians/Chamorros | 99.9 /100 | #49 | Exceptional 8.0% |
| Belgians | 99.9 /100 | #50 | Exceptional 8.0% |
| Koreans | 99.9 /100 | #51 | Exceptional 8.0% |
| Hawaiians | 99.9 /100 | #52 | Exceptional 8.0% |
| Slovenes | 99.9 /100 | #53 | Exceptional 8.0% |
| Immigrants | Venezuela | 99.9 /100 | #54 | Exceptional 8.1% |
| Celtics | 99.9 /100 | #55 | Exceptional 8.1% |
| Immigrants | Afghanistan | 99.9 /100 | #56 | Exceptional 8.1% |
| Venezuelans | 99.8 /100 | #57 | Exceptional 8.1% |
| Immigrants | Mexico | 99.8 /100 | #58 | Exceptional 8.1% |
| Immigrants | India | 99.8 /100 | #59 | Exceptional 8.2% |
| Immigrants | Laos | 99.8 /100 | #60 | Exceptional 8.2% |
| Thais | 99.8 /100 | #61 | Exceptional 8.2% |
| Chinese | 99.8 /100 | #62 | Exceptional 8.2% |
| Slovaks | 99.8 /100 | #63 | Exceptional 8.3% |
Demographics Similar to Immigrants from Bangladesh by No Vehicles in Household
In terms of no vehicles in household, the demographic groups most similar to Immigrants from Bangladesh are Barbadian (26.1%, a difference of 1.3%), Vietnamese (26.2%, a difference of 1.9%), Immigrants from Uzbekistan (26.7%, a difference of 3.5%), Immigrants from Trinidad and Tobago (24.6%, a difference of 4.5%), and Immigrants from Ecuador (23.8%, a difference of 8.1%).
| Demographics | Rating | Rank | No Vehicles in Household |
| Immigrants | Senegal | 0.0 /100 | #327 | Tragic 21.1% |
| Immigrants | Dominica | 0.0 /100 | #328 | Tragic 22.2% |
| Ecuadorians | 0.0 /100 | #329 | Tragic 22.8% |
| West Indians | 0.0 /100 | #330 | Tragic 23.7% |
| Trinidadians and Tobagonians | 0.0 /100 | #331 | Tragic 23.7% |
| Immigrants | Ecuador | 0.0 /100 | #332 | Tragic 23.8% |
| Immigrants | Trinidad and Tobago | 0.0 /100 | #333 | Tragic 24.6% |
| Immigrants | Bangladesh | 0.0 /100 | #334 | Tragic 25.8% |
| Barbadians | 0.0 /100 | #335 | Tragic 26.1% |
| Vietnamese | 0.0 /100 | #336 | Tragic 26.2% |
| Immigrants | Uzbekistan | 0.0 /100 | #337 | Tragic 26.7% |
| Guyanese | 0.0 /100 | #338 | Tragic 29.3% |
| Dominicans | 0.0 /100 | #339 | Tragic 29.4% |
| Immigrants | Barbados | 0.0 /100 | #340 | Tragic 29.5% |
| Immigrants | Guyana | 0.0 /100 | #341 | Tragic 29.5% |