Hmong vs Spaniard Kindergarten
COMPARE
Hmong
Spaniard
Kindergarten
Kindergarten Comparison
Hmong
Spaniards
98.1%
KINDERGARTEN
78.8/ 100
METRIC RATING
145th/ 347
METRIC RANK
98.1%
KINDERGARTEN
91.0/ 100
METRIC RATING
132nd/ 347
METRIC RANK
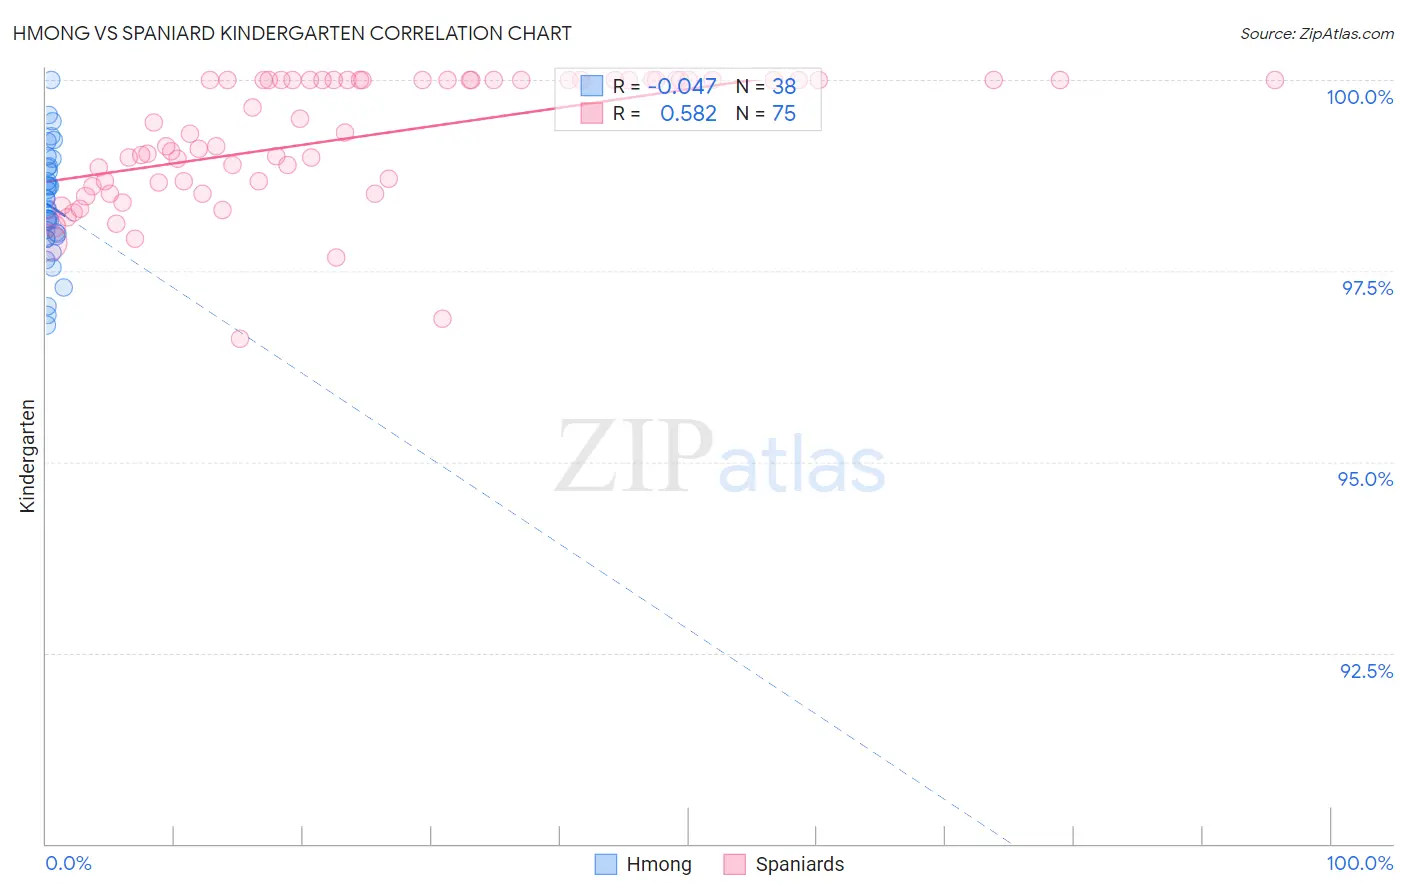
Hmong vs Spaniard Kindergarten Correlation Chart
The statistical analysis conducted on geographies consisting of 24,672,093 people shows no correlation between the proportion of Hmong and percentage of population with at least kindergarten education in the United States with a correlation coefficient (R) of -0.047 and weighted average of 98.1%. Similarly, the statistical analysis conducted on geographies consisting of 443,544,503 people shows a substantial positive correlation between the proportion of Spaniards and percentage of population with at least kindergarten education in the United States with a correlation coefficient (R) of 0.582 and weighted average of 98.1%, a difference of 0.080%.
Kindergarten Correlation Summary
| Measurement | Hmong | Spaniard |
| Minimum | 96.8% | 96.6% |
| Maximum | 100.0% | 100.0% |
| Range | 3.2% | 3.4% |
| Mean | 98.4% | 99.2% |
| Median | 98.3% | 99.3% |
| Interquartile 25% (IQ1) | 98.0% | 98.7% |
| Interquartile 75% (IQ3) | 98.9% | 100.0% |
| Interquartile Range (IQR) | 0.90% | 1.3% |
| Standard Deviation (Sample) | 0.73% | 0.83% |
| Standard Deviation (Population) | 0.72% | 0.83% |
Demographics Similar to Hmong and Spaniards by Kindergarten
In terms of kindergarten, the demographic groups most similar to Hmong are Filipino (98.0%, a difference of 0.0%), Burmese (98.1%, a difference of 0.010%), Alsatian (98.1%, a difference of 0.010%), Immigrants from Israel (98.0%, a difference of 0.010%), and Palestinian (98.1%, a difference of 0.020%). Similarly, the demographic groups most similar to Spaniards are Seminole (98.1%, a difference of 0.0%), Immigrants from Croatia (98.1%, a difference of 0.0%), Cambodian (98.1%, a difference of 0.0%), Immigrants from Serbia (98.1%, a difference of 0.010%), and Immigrants from Europe (98.1%, a difference of 0.010%).
| Demographics | Rating | Rank | Kindergarten |
| Immigrants | Serbia | 92.4 /100 | #128 | Exceptional 98.1% |
| Seminole | 91.5 /100 | #129 | Exceptional 98.1% |
| Immigrants | Croatia | 91.2 /100 | #130 | Exceptional 98.1% |
| Cambodians | 91.2 /100 | #131 | Exceptional 98.1% |
| Spaniards | 91.0 /100 | #132 | Exceptional 98.1% |
| Immigrants | Europe | 90.4 /100 | #133 | Exceptional 98.1% |
| Immigrants | Bulgaria | 89.4 /100 | #134 | Excellent 98.1% |
| Immigrants | Kuwait | 89.2 /100 | #135 | Excellent 98.1% |
| Immigrants | Hungary | 89.1 /100 | #136 | Excellent 98.1% |
| Blackfeet | 87.8 /100 | #137 | Excellent 98.1% |
| Immigrants | Romania | 87.7 /100 | #138 | Excellent 98.1% |
| Israelis | 87.7 /100 | #139 | Excellent 98.1% |
| Palestinians | 83.6 /100 | #140 | Excellent 98.1% |
| Marshallese | 83.0 /100 | #141 | Excellent 98.1% |
| Immigrants | Turkey | 82.8 /100 | #142 | Excellent 98.1% |
| Burmese | 81.5 /100 | #143 | Excellent 98.1% |
| Alsatians | 80.4 /100 | #144 | Excellent 98.1% |
| Hmong | 78.8 /100 | #145 | Good 98.1% |
| Filipinos | 78.3 /100 | #146 | Good 98.0% |
| Immigrants | Israel | 77.6 /100 | #147 | Good 98.0% |
| Apache | 75.0 /100 | #148 | Good 98.0% |