Hmong vs Honduran 2 or more Vehicles in Household
COMPARE
Hmong
Honduran
2 or more Vehicles in Household
2 or more Vehicles in Household Comparison
Hmong
Hondurans
57.8%
2 OR MORE VEHICLES IN HOUSEHOLD
98.9/ 100
METRIC RATING
95th/ 347
METRIC RANK
52.0%
2 OR MORE VEHICLES IN HOUSEHOLD
0.2/ 100
METRIC RATING
269th/ 347
METRIC RANK
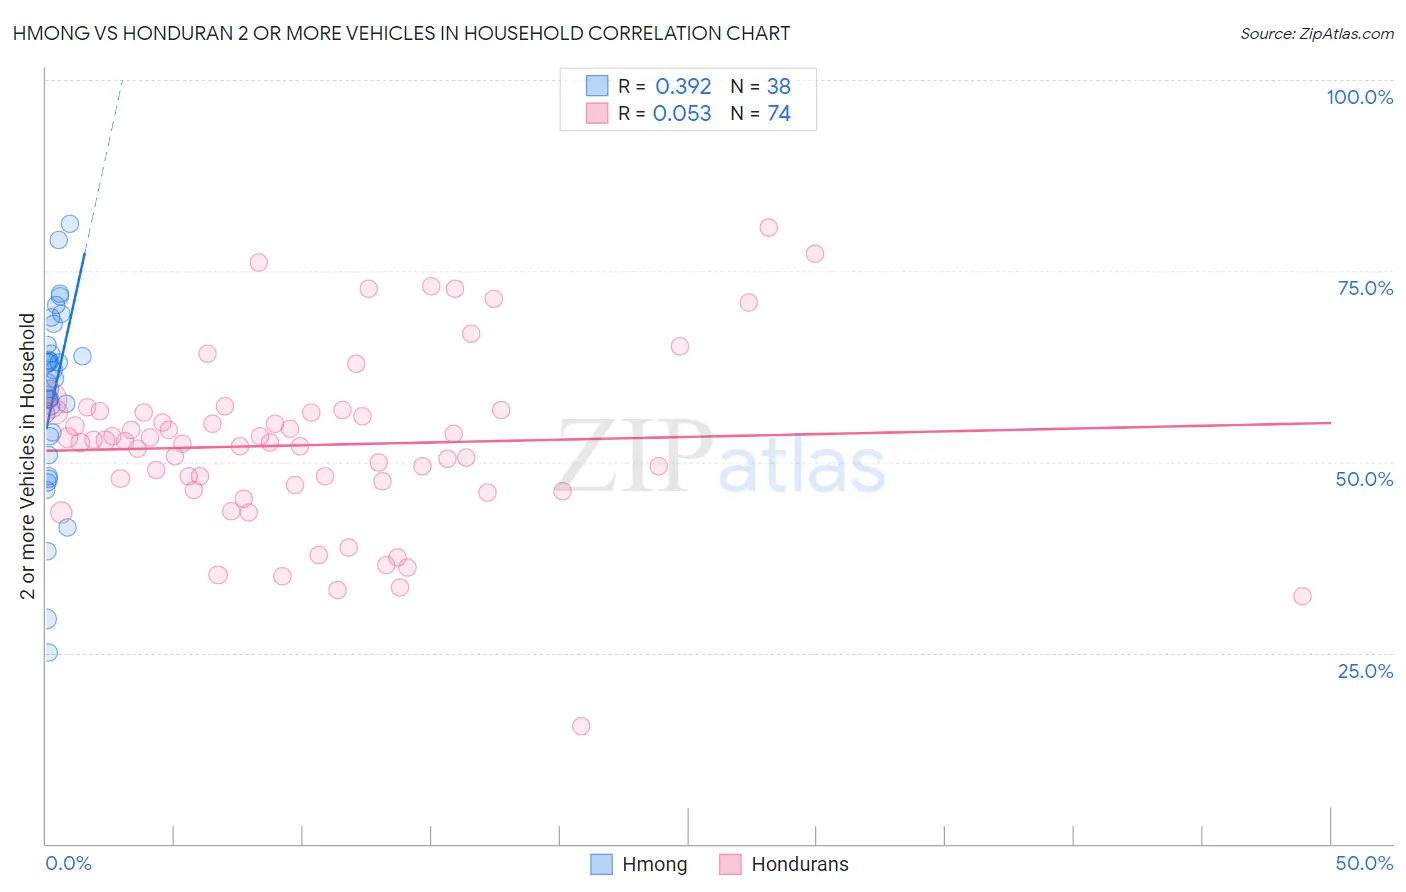
Hmong vs Honduran 2 or more Vehicles in Household Correlation Chart
The statistical analysis conducted on geographies consisting of 24,669,739 people shows a mild positive correlation between the proportion of Hmong and percentage of households with 2 or more vehicles available in the United States with a correlation coefficient (R) of 0.392 and weighted average of 57.8%. Similarly, the statistical analysis conducted on geographies consisting of 357,629,870 people shows a slight positive correlation between the proportion of Hondurans and percentage of households with 2 or more vehicles available in the United States with a correlation coefficient (R) of 0.053 and weighted average of 52.0%, a difference of 11.2%.
2 or more Vehicles in Household Correlation Summary
| Measurement | Hmong | Honduran |
| Minimum | 25.0% | 15.4% |
| Maximum | 81.2% | 80.6% |
| Range | 56.2% | 65.2% |
| Mean | 58.4% | 52.2% |
| Median | 60.0% | 52.6% |
| Interquartile 25% (IQ1) | 53.3% | 47.0% |
| Interquartile 75% (IQ3) | 64.2% | 56.5% |
| Interquartile Range (IQR) | 10.9% | 9.5% |
| Standard Deviation (Sample) | 11.9% | 11.5% |
| Standard Deviation (Population) | 11.8% | 11.4% |
Similar Demographics by 2 or more Vehicles in Household
Demographics Similar to Hmong by 2 or more Vehicles in Household
In terms of 2 or more vehicles in household, the demographic groups most similar to Hmong are Filipino (57.8%, a difference of 0.020%), Burmese (57.8%, a difference of 0.030%), Slavic (57.8%, a difference of 0.060%), Ottawa (57.9%, a difference of 0.080%), and Shoshone (57.9%, a difference of 0.090%).
| Demographics | Rating | Rank | 2 or more Vehicles in Household |
| Immigrants | Iran | 99.1 /100 | #88 | Exceptional 57.9% |
| Immigrants | Germany | 99.0 /100 | #89 | Exceptional 57.9% |
| Hispanics or Latinos | 99.0 /100 | #90 | Exceptional 57.9% |
| Pakistanis | 99.0 /100 | #91 | Exceptional 57.9% |
| Shoshone | 99.0 /100 | #92 | Exceptional 57.9% |
| Ottawa | 99.0 /100 | #93 | Exceptional 57.9% |
| Filipinos | 98.9 /100 | #94 | Exceptional 57.8% |
| Hmong | 98.9 /100 | #95 | Exceptional 57.8% |
| Burmese | 98.8 /100 | #96 | Exceptional 57.8% |
| Slavs | 98.8 /100 | #97 | Exceptional 57.8% |
| Palestinians | 98.6 /100 | #98 | Exceptional 57.7% |
| Cajuns | 98.5 /100 | #99 | Exceptional 57.7% |
| Fijians | 98.4 /100 | #100 | Exceptional 57.6% |
| Lebanese | 98.3 /100 | #101 | Exceptional 57.6% |
| Immigrants | Bolivia | 98.2 /100 | #102 | Exceptional 57.6% |
Demographics Similar to Hondurans by 2 or more Vehicles in Household
In terms of 2 or more vehicles in household, the demographic groups most similar to Hondurans are Immigrants from Colombia (52.0%, a difference of 0.010%), Pima (52.0%, a difference of 0.010%), Immigrants from Ireland (52.0%, a difference of 0.020%), Immigrants from France (52.0%, a difference of 0.060%), and South American (51.9%, a difference of 0.19%).
| Demographics | Rating | Rank | 2 or more Vehicles in Household |
| Immigrants | Northern Africa | 0.4 /100 | #262 | Tragic 52.3% |
| Immigrants | Southern Europe | 0.4 /100 | #263 | Tragic 52.3% |
| Immigrants | Latvia | 0.4 /100 | #264 | Tragic 52.2% |
| Immigrants | Congo | 0.3 /100 | #265 | Tragic 52.1% |
| Immigrants | France | 0.2 /100 | #266 | Tragic 52.0% |
| Immigrants | Colombia | 0.2 /100 | #267 | Tragic 52.0% |
| Pima | 0.2 /100 | #268 | Tragic 52.0% |
| Hondurans | 0.2 /100 | #269 | Tragic 52.0% |
| Immigrants | Ireland | 0.2 /100 | #270 | Tragic 52.0% |
| South Americans | 0.2 /100 | #271 | Tragic 51.9% |
| Sub-Saharan Africans | 0.2 /100 | #272 | Tragic 51.9% |
| Israelis | 0.2 /100 | #273 | Tragic 51.9% |
| Africans | 0.2 /100 | #274 | Tragic 51.8% |
| Immigrants | Honduras | 0.2 /100 | #275 | Tragic 51.8% |
| Immigrants | Croatia | 0.2 /100 | #276 | Tragic 51.8% |