Hmong vs African 1 or more Vehicles in Household
COMPARE
Hmong
African
1 or more Vehicles in Household
1 or more Vehicles in Household Comparison
Hmong
Africans
89.6%
1 OR MORE VEHICLES IN HOUSEHOLD
45.8/ 100
METRIC RATING
177th/ 347
METRIC RANK
87.8%
1 OR MORE VEHICLES IN HOUSEHOLD
0.4/ 100
METRIC RATING
265th/ 347
METRIC RANK
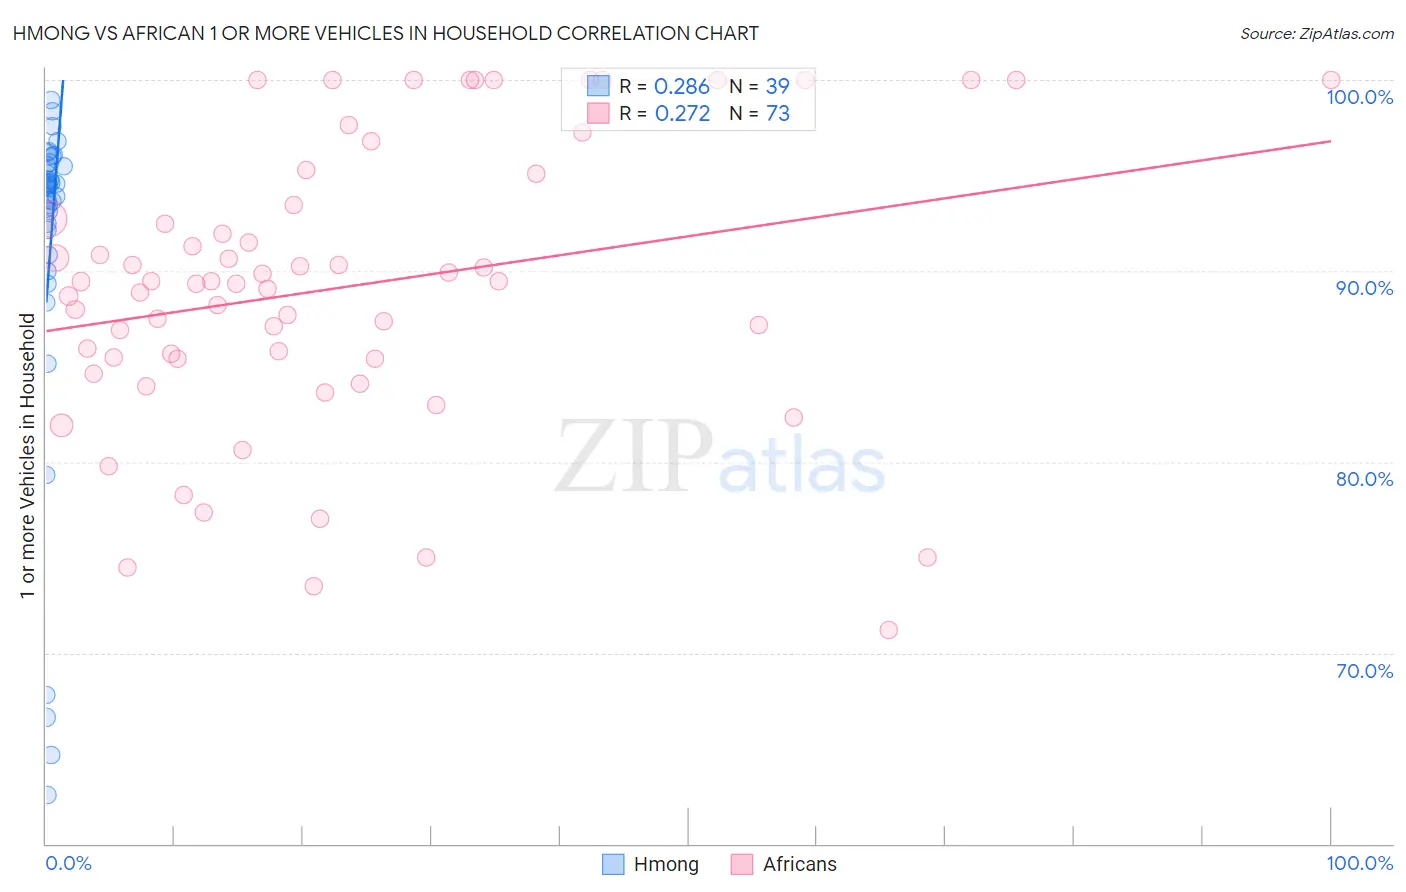
Hmong vs African 1 or more Vehicles in Household Correlation Chart
The statistical analysis conducted on geographies consisting of 24,678,157 people shows a weak positive correlation between the proportion of Hmong and percentage of households with 1 or more vehicles available in the United States with a correlation coefficient (R) of 0.286 and weighted average of 89.6%. Similarly, the statistical analysis conducted on geographies consisting of 469,659,613 people shows a weak positive correlation between the proportion of Africans and percentage of households with 1 or more vehicles available in the United States with a correlation coefficient (R) of 0.272 and weighted average of 87.8%, a difference of 2.1%.
1 or more Vehicles in Household Correlation Summary
| Measurement | Hmong | African |
| Minimum | 62.6% | 71.2% |
| Maximum | 99.0% | 100.0% |
| Range | 36.4% | 28.8% |
| Mean | 90.8% | 89.2% |
| Median | 94.5% | 89.4% |
| Interquartile 25% (IQ1) | 90.8% | 85.4% |
| Interquartile 75% (IQ3) | 95.5% | 94.3% |
| Interquartile Range (IQR) | 4.7% | 8.9% |
| Standard Deviation (Sample) | 9.4% | 7.4% |
| Standard Deviation (Population) | 9.3% | 7.4% |
Similar Demographics by 1 or more Vehicles in Household
Demographics Similar to Hmong by 1 or more Vehicles in Household
In terms of 1 or more vehicles in household, the demographic groups most similar to Hmong are Immigrants from Sudan (89.7%, a difference of 0.020%), Immigrants from Burma/Myanmar (89.7%, a difference of 0.030%), Immigrants from El Salvador (89.6%, a difference of 0.030%), German Russian (89.6%, a difference of 0.030%), and Arab (89.6%, a difference of 0.040%).
| Demographics | Rating | Rank | 1 or more Vehicles in Household |
| Immigrants | Costa Rica | 57.6 /100 | #170 | Average 89.8% |
| French American Indians | 54.4 /100 | #171 | Average 89.8% |
| Indonesians | 53.0 /100 | #172 | Average 89.7% |
| Lumbee | 52.8 /100 | #173 | Average 89.7% |
| Filipinos | 50.0 /100 | #174 | Average 89.7% |
| Immigrants | Burma/Myanmar | 47.6 /100 | #175 | Average 89.7% |
| Immigrants | Sudan | 47.1 /100 | #176 | Average 89.7% |
| Hmong | 45.8 /100 | #177 | Average 89.6% |
| Immigrants | El Salvador | 44.1 /100 | #178 | Average 89.6% |
| German Russians | 44.0 /100 | #179 | Average 89.6% |
| Arabs | 43.3 /100 | #180 | Average 89.6% |
| Immigrants | Ethiopia | 42.5 /100 | #181 | Average 89.6% |
| Ukrainians | 42.4 /100 | #182 | Average 89.6% |
| Ethiopians | 41.2 /100 | #183 | Average 89.6% |
| Immigrants | Bulgaria | 40.7 /100 | #184 | Average 89.6% |
Demographics Similar to Africans by 1 or more Vehicles in Household
In terms of 1 or more vehicles in household, the demographic groups most similar to Africans are Immigrants from Liberia (87.8%, a difference of 0.020%), Immigrants from Egypt (87.8%, a difference of 0.040%), Subsaharan African (87.9%, a difference of 0.11%), Immigrants from Switzerland (87.9%, a difference of 0.14%), and Israeli (87.7%, a difference of 0.14%).
| Demographics | Rating | Rank | 1 or more Vehicles in Household |
| South American Indians | 0.9 /100 | #258 | Tragic 88.0% |
| Nigerians | 0.8 /100 | #259 | Tragic 88.0% |
| Macedonians | 0.6 /100 | #260 | Tragic 87.9% |
| Immigrants | Switzerland | 0.6 /100 | #261 | Tragic 87.9% |
| Sub-Saharan Africans | 0.5 /100 | #262 | Tragic 87.9% |
| Immigrants | Egypt | 0.5 /100 | #263 | Tragic 87.8% |
| Immigrants | Liberia | 0.4 /100 | #264 | Tragic 87.8% |
| Africans | 0.4 /100 | #265 | Tragic 87.8% |
| Israelis | 0.3 /100 | #266 | Tragic 87.7% |
| Immigrants | Colombia | 0.3 /100 | #267 | Tragic 87.6% |
| Immigrants | Europe | 0.2 /100 | #268 | Tragic 87.6% |
| Immigrants | Africa | 0.2 /100 | #269 | Tragic 87.6% |
| Panamanians | 0.2 /100 | #270 | Tragic 87.5% |
| Bermudans | 0.2 /100 | #271 | Tragic 87.5% |
| Aleuts | 0.2 /100 | #272 | Tragic 87.5% |