Hmong vs Immigrants from Honduras 1 or more Vehicles in Household
COMPARE
Hmong
Immigrants from Honduras
1 or more Vehicles in Household
1 or more Vehicles in Household Comparison
Hmong
Immigrants from Honduras
89.6%
1 OR MORE VEHICLES IN HOUSEHOLD
45.8/ 100
METRIC RATING
177th/ 347
METRIC RANK
88.3%
1 OR MORE VEHICLES IN HOUSEHOLD
1.7/ 100
METRIC RATING
247th/ 347
METRIC RANK
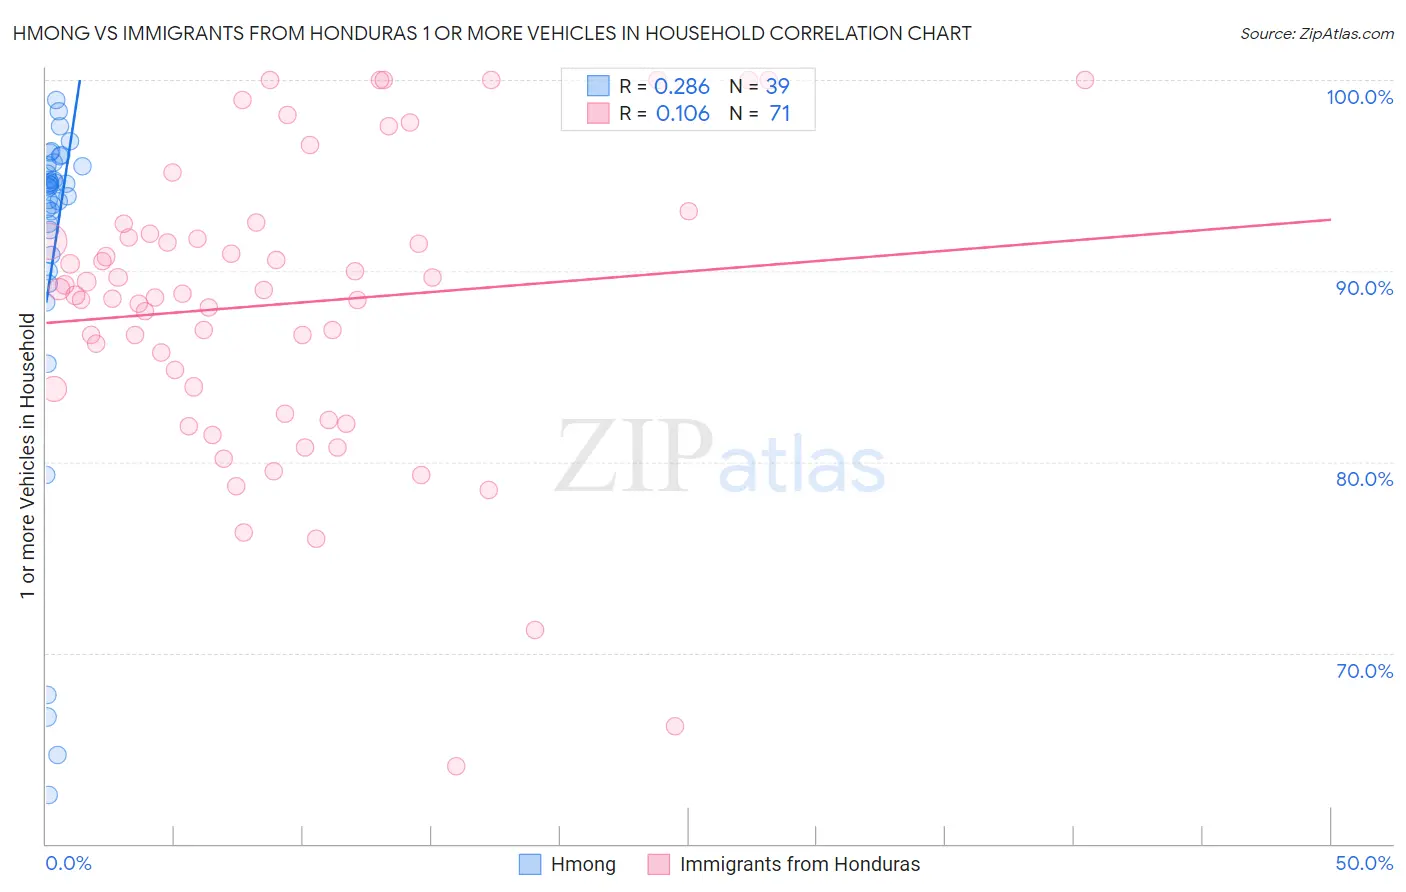
Hmong vs Immigrants from Honduras 1 or more Vehicles in Household Correlation Chart
The statistical analysis conducted on geographies consisting of 24,678,157 people shows a weak positive correlation between the proportion of Hmong and percentage of households with 1 or more vehicles available in the United States with a correlation coefficient (R) of 0.286 and weighted average of 89.6%. Similarly, the statistical analysis conducted on geographies consisting of 322,472,678 people shows a poor positive correlation between the proportion of Immigrants from Honduras and percentage of households with 1 or more vehicles available in the United States with a correlation coefficient (R) of 0.106 and weighted average of 88.3%, a difference of 1.5%.
1 or more Vehicles in Household Correlation Summary
| Measurement | Hmong | Immigrants from Honduras |
| Minimum | 62.6% | 64.1% |
| Maximum | 99.0% | 100.0% |
| Range | 36.4% | 35.9% |
| Mean | 90.8% | 88.3% |
| Median | 94.5% | 88.8% |
| Interquartile 25% (IQ1) | 90.8% | 83.8% |
| Interquartile 75% (IQ3) | 95.5% | 92.0% |
| Interquartile Range (IQR) | 4.7% | 8.2% |
| Standard Deviation (Sample) | 9.4% | 7.8% |
| Standard Deviation (Population) | 9.3% | 7.7% |
Similar Demographics by 1 or more Vehicles in Household
Demographics Similar to Hmong by 1 or more Vehicles in Household
In terms of 1 or more vehicles in household, the demographic groups most similar to Hmong are Immigrants from Sudan (89.7%, a difference of 0.020%), Immigrants from Burma/Myanmar (89.7%, a difference of 0.030%), Immigrants from El Salvador (89.6%, a difference of 0.030%), German Russian (89.6%, a difference of 0.030%), and Arab (89.6%, a difference of 0.040%).
| Demographics | Rating | Rank | 1 or more Vehicles in Household |
| Immigrants | Costa Rica | 57.6 /100 | #170 | Average 89.8% |
| French American Indians | 54.4 /100 | #171 | Average 89.8% |
| Indonesians | 53.0 /100 | #172 | Average 89.7% |
| Lumbee | 52.8 /100 | #173 | Average 89.7% |
| Filipinos | 50.0 /100 | #174 | Average 89.7% |
| Immigrants | Burma/Myanmar | 47.6 /100 | #175 | Average 89.7% |
| Immigrants | Sudan | 47.1 /100 | #176 | Average 89.7% |
| Hmong | 45.8 /100 | #177 | Average 89.6% |
| Immigrants | El Salvador | 44.1 /100 | #178 | Average 89.6% |
| German Russians | 44.0 /100 | #179 | Average 89.6% |
| Arabs | 43.3 /100 | #180 | Average 89.6% |
| Immigrants | Ethiopia | 42.5 /100 | #181 | Average 89.6% |
| Ukrainians | 42.4 /100 | #182 | Average 89.6% |
| Ethiopians | 41.2 /100 | #183 | Average 89.6% |
| Immigrants | Bulgaria | 40.7 /100 | #184 | Average 89.6% |
Demographics Similar to Immigrants from Honduras by 1 or more Vehicles in Household
In terms of 1 or more vehicles in household, the demographic groups most similar to Immigrants from Honduras are Menominee (88.3%, a difference of 0.040%), Immigrants from Czechoslovakia (88.3%, a difference of 0.050%), Immigrants from Nigeria (88.2%, a difference of 0.050%), Immigrants from Portugal (88.3%, a difference of 0.060%), and Immigrants from Belgium (88.4%, a difference of 0.080%).
| Demographics | Rating | Rank | 1 or more Vehicles in Household |
| Eastern Europeans | 3.0 /100 | #240 | Tragic 88.5% |
| Taiwanese | 2.6 /100 | #241 | Tragic 88.4% |
| Turks | 2.5 /100 | #242 | Tragic 88.4% |
| Immigrants | Belgium | 2.1 /100 | #243 | Tragic 88.4% |
| Immigrants | Portugal | 2.0 /100 | #244 | Tragic 88.3% |
| Immigrants | Czechoslovakia | 1.9 /100 | #245 | Tragic 88.3% |
| Menominee | 1.9 /100 | #246 | Tragic 88.3% |
| Immigrants | Honduras | 1.7 /100 | #247 | Tragic 88.3% |
| Immigrants | Nigeria | 1.5 /100 | #248 | Tragic 88.2% |
| Blacks/African Americans | 1.4 /100 | #249 | Tragic 88.2% |
| Egyptians | 1.2 /100 | #250 | Tragic 88.2% |
| Immigrants | Serbia | 1.2 /100 | #251 | Tragic 88.2% |
| Immigrants | Uruguay | 1.1 /100 | #252 | Tragic 88.1% |
| Hondurans | 1.0 /100 | #253 | Tragic 88.1% |
| Haitians | 0.9 /100 | #254 | Tragic 88.1% |