Hmong vs African 4th Grade
COMPARE
Hmong
African
4th Grade
4th Grade Comparison
Hmong
Africans
97.7%
4TH GRADE
88.2/ 100
METRIC RATING
133rd/ 347
METRIC RANK
97.4%
4TH GRADE
14.6/ 100
METRIC RATING
204th/ 347
METRIC RANK
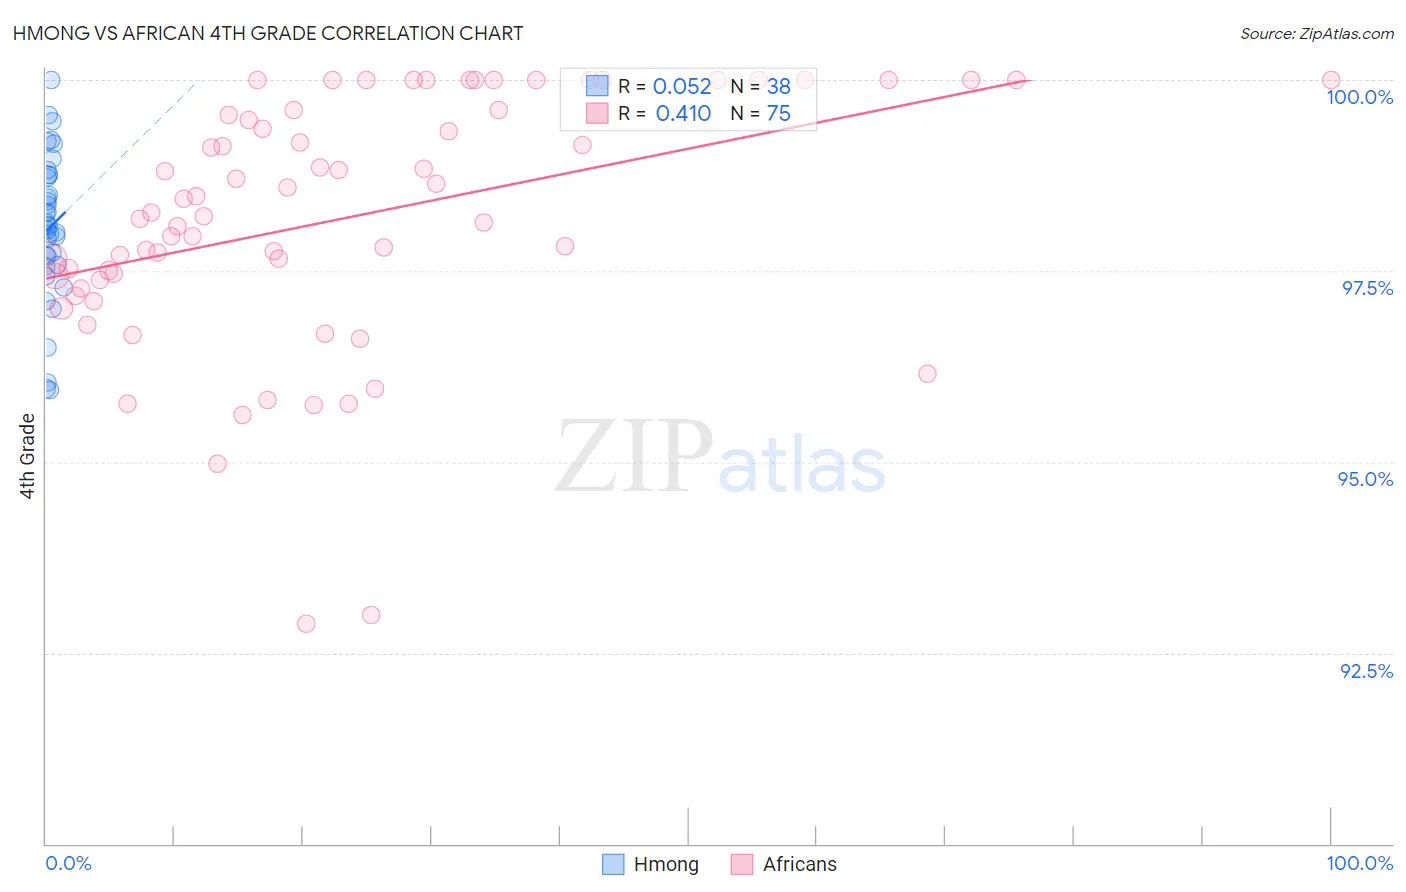
Hmong vs African 4th Grade Correlation Chart
The statistical analysis conducted on geographies consisting of 24,672,093 people shows a slight positive correlation between the proportion of Hmong and percentage of population with at least 4th grade education in the United States with a correlation coefficient (R) of 0.052 and weighted average of 97.7%. Similarly, the statistical analysis conducted on geographies consisting of 470,094,744 people shows a moderate positive correlation between the proportion of Africans and percentage of population with at least 4th grade education in the United States with a correlation coefficient (R) of 0.410 and weighted average of 97.4%, a difference of 0.36%.
4th Grade Correlation Summary
| Measurement | Hmong | African |
| Minimum | 95.9% | 92.9% |
| Maximum | 100.0% | 100.0% |
| Range | 4.1% | 7.1% |
| Mean | 98.1% | 98.2% |
| Median | 98.1% | 98.3% |
| Interquartile 25% (IQ1) | 97.6% | 97.4% |
| Interquartile 75% (IQ3) | 98.8% | 99.6% |
| Interquartile Range (IQR) | 1.2% | 2.2% |
| Standard Deviation (Sample) | 0.97% | 1.6% |
| Standard Deviation (Population) | 0.95% | 1.6% |
Similar Demographics by 4th Grade
Demographics Similar to Hmong by 4th Grade
In terms of 4th grade, the demographic groups most similar to Hmong are Palestinian (97.7%, a difference of 0.0%), Cambodian (97.7%, a difference of 0.0%), Immigrants from Kuwait (97.7%, a difference of 0.010%), Immigrants from Hungary (97.7%, a difference of 0.010%), and Immigrants from Romania (97.7%, a difference of 0.020%).
| Demographics | Rating | Rank | 4th Grade |
| Immigrants | Europe | 92.5 /100 | #126 | Exceptional 97.8% |
| Colville | 92.3 /100 | #127 | Exceptional 97.7% |
| Pima | 92.0 /100 | #128 | Exceptional 97.7% |
| Immigrants | Bulgaria | 91.3 /100 | #129 | Exceptional 97.7% |
| Immigrants | Romania | 90.6 /100 | #130 | Exceptional 97.7% |
| Immigrants | Kuwait | 89.7 /100 | #131 | Excellent 97.7% |
| Immigrants | Hungary | 89.3 /100 | #132 | Excellent 97.7% |
| Hmong | 88.2 /100 | #133 | Excellent 97.7% |
| Palestinians | 88.1 /100 | #134 | Excellent 97.7% |
| Cambodians | 87.8 /100 | #135 | Excellent 97.7% |
| Israelis | 86.2 /100 | #136 | Excellent 97.7% |
| Immigrants | Turkey | 86.0 /100 | #137 | Excellent 97.7% |
| Blackfeet | 86.0 /100 | #138 | Excellent 97.7% |
| Seminole | 84.7 /100 | #139 | Excellent 97.7% |
| Filipinos | 84.0 /100 | #140 | Excellent 97.7% |
Demographics Similar to Africans by 4th Grade
In terms of 4th grade, the demographic groups most similar to Africans are Immigrants from Northern Africa (97.4%, a difference of 0.0%), Immigrants from Southern Europe (97.4%, a difference of 0.010%), Immigrants from Chile (97.4%, a difference of 0.010%), Paiute (97.3%, a difference of 0.010%), and Immigrants from Zaire (97.3%, a difference of 0.010%).
| Demographics | Rating | Rank | 4th Grade |
| Hawaiians | 25.6 /100 | #197 | Fair 97.4% |
| Guamanians/Chamorros | 23.0 /100 | #198 | Fair 97.4% |
| Natives/Alaskans | 20.6 /100 | #199 | Fair 97.4% |
| Immigrants | Uganda | 19.8 /100 | #200 | Poor 97.4% |
| Immigrants | Southern Europe | 16.2 /100 | #201 | Poor 97.4% |
| Immigrants | Chile | 16.1 /100 | #202 | Poor 97.4% |
| Immigrants | Northern Africa | 15.1 /100 | #203 | Poor 97.4% |
| Africans | 14.6 /100 | #204 | Poor 97.4% |
| Paiute | 13.2 /100 | #205 | Poor 97.3% |
| Immigrants | Zaire | 12.8 /100 | #206 | Poor 97.3% |
| Moroccans | 11.3 /100 | #207 | Poor 97.3% |
| Immigrants | Bahamas | 10.8 /100 | #208 | Poor 97.3% |
| Laotians | 9.3 /100 | #209 | Tragic 97.3% |
| Immigrants | Oceania | 9.1 /100 | #210 | Tragic 97.3% |
| Sudanese | 9.0 /100 | #211 | Tragic 97.3% |