Hmong vs African Births to Unmarried Women
COMPARE
Hmong
African
Births to Unmarried Women
Births to Unmarried Women Comparison
Hmong
Africans
27.7%
BIRTHS TO UNMARRIED WOMEN
99.5/ 100
METRIC RATING
47th/ 347
METRIC RANK
39.7%
BIRTHS TO UNMARRIED WOMEN
0.0/ 100
METRIC RATING
313th/ 347
METRIC RANK
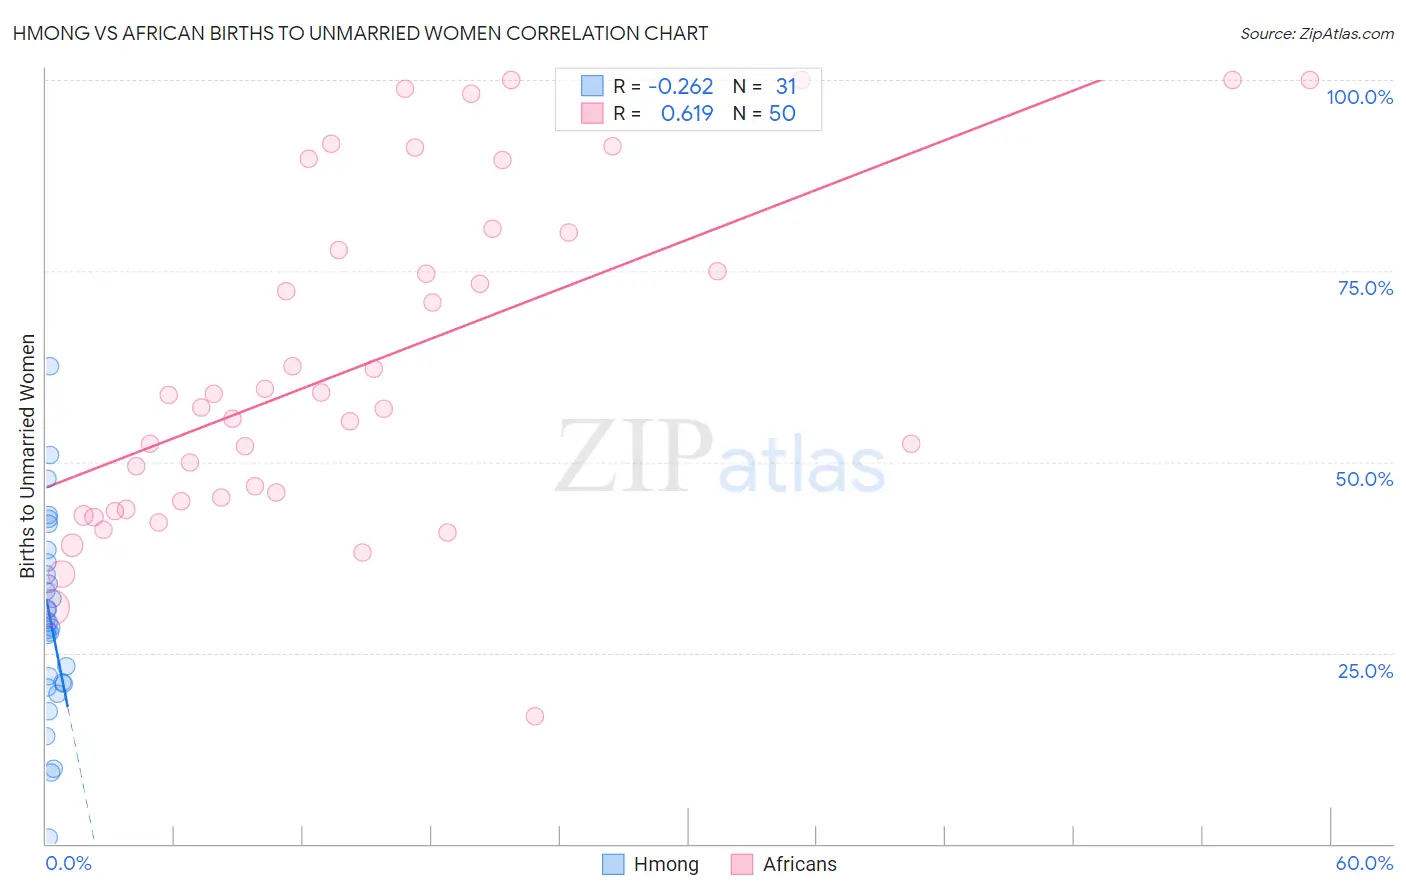
Hmong vs African Births to Unmarried Women Correlation Chart
The statistical analysis conducted on geographies consisting of 24,592,698 people shows a weak negative correlation between the proportion of Hmong and percentage of births to unmarried women in the United States with a correlation coefficient (R) of -0.262 and weighted average of 27.7%. Similarly, the statistical analysis conducted on geographies consisting of 441,094,668 people shows a significant positive correlation between the proportion of Africans and percentage of births to unmarried women in the United States with a correlation coefficient (R) of 0.619 and weighted average of 39.7%, a difference of 43.2%.
Births to Unmarried Women Correlation Summary
| Measurement | Hmong | African |
| Minimum | 0.90% | 16.7% |
| Maximum | 62.6% | 100.0% |
| Range | 61.7% | 83.3% |
| Mean | 29.3% | 62.7% |
| Median | 29.0% | 58.0% |
| Interquartile 25% (IQ1) | 21.0% | 44.9% |
| Interquartile 75% (IQ3) | 36.9% | 80.0% |
| Interquartile Range (IQR) | 15.9% | 35.1% |
| Standard Deviation (Sample) | 13.0% | 21.9% |
| Standard Deviation (Population) | 12.7% | 21.6% |
Similar Demographics by Births to Unmarried Women
Demographics Similar to Hmong by Births to Unmarried Women
In terms of births to unmarried women, the demographic groups most similar to Hmong are Immigrants from Lithuania (27.7%, a difference of 0.0%), Eastern European (27.7%, a difference of 0.010%), Latvian (27.7%, a difference of 0.040%), Immigrants from Indonesia (27.7%, a difference of 0.14%), and Immigrants from Greece (27.8%, a difference of 0.20%).
| Demographics | Rating | Rank | Births to Unmarried Women |
| Turks | 99.6 /100 | #40 | Exceptional 27.4% |
| Iraqis | 99.6 /100 | #41 | Exceptional 27.6% |
| Immigrants | Eastern Europe | 99.6 /100 | #42 | Exceptional 27.6% |
| Immigrants | Bulgaria | 99.6 /100 | #43 | Exceptional 27.6% |
| Immigrants | Indonesia | 99.5 /100 | #44 | Exceptional 27.7% |
| Latvians | 99.5 /100 | #45 | Exceptional 27.7% |
| Immigrants | Lithuania | 99.5 /100 | #46 | Exceptional 27.7% |
| Hmong | 99.5 /100 | #47 | Exceptional 27.7% |
| Eastern Europeans | 99.5 /100 | #48 | Exceptional 27.7% |
| Immigrants | Greece | 99.4 /100 | #49 | Exceptional 27.8% |
| Maltese | 99.4 /100 | #50 | Exceptional 27.8% |
| Macedonians | 99.4 /100 | #51 | Exceptional 27.9% |
| Bhutanese | 99.4 /100 | #52 | Exceptional 27.9% |
| Immigrants | Romania | 99.4 /100 | #53 | Exceptional 27.9% |
| Afghans | 99.4 /100 | #54 | Exceptional 27.9% |
Demographics Similar to Africans by Births to Unmarried Women
In terms of births to unmarried women, the demographic groups most similar to Africans are Immigrants from Caribbean (39.8%, a difference of 0.29%), Dominican (39.8%, a difference of 0.33%), U.S. Virgin Islander (39.6%, a difference of 0.34%), Immigrants from the Azores (39.6%, a difference of 0.36%), and Apache (39.9%, a difference of 0.38%).
| Demographics | Rating | Rank | Births to Unmarried Women |
| Central American Indians | 0.0 /100 | #306 | Tragic 39.0% |
| Immigrants | Honduras | 0.0 /100 | #307 | Tragic 39.3% |
| Aleuts | 0.0 /100 | #308 | Tragic 39.3% |
| Cubans | 0.0 /100 | #309 | Tragic 39.4% |
| Immigrants | Dominica | 0.0 /100 | #310 | Tragic 39.5% |
| Immigrants | Azores | 0.0 /100 | #311 | Tragic 39.6% |
| U.S. Virgin Islanders | 0.0 /100 | #312 | Tragic 39.6% |
| Africans | 0.0 /100 | #313 | Tragic 39.7% |
| Immigrants | Caribbean | 0.0 /100 | #314 | Tragic 39.8% |
| Dominicans | 0.0 /100 | #315 | Tragic 39.8% |
| Apache | 0.0 /100 | #316 | Tragic 39.9% |
| Immigrants | Dominican Republic | 0.0 /100 | #317 | Tragic 40.1% |
| Immigrants | Bahamas | 0.0 /100 | #318 | Tragic 40.1% |
| Yakama | 0.0 /100 | #319 | Tragic 40.3% |
| Crow | 0.0 /100 | #320 | Tragic 40.4% |