U.S. Virgin Islander vs African 1 or more Vehicles in Household
COMPARE
U.S. Virgin Islander
African
1 or more Vehicles in Household
1 or more Vehicles in Household Comparison
U.S. Virgin Islanders
Africans
84.6%
1 OR MORE VEHICLES IN HOUSEHOLD
0.0/ 100
METRIC RATING
310th/ 347
METRIC RANK
87.8%
1 OR MORE VEHICLES IN HOUSEHOLD
0.4/ 100
METRIC RATING
265th/ 347
METRIC RANK
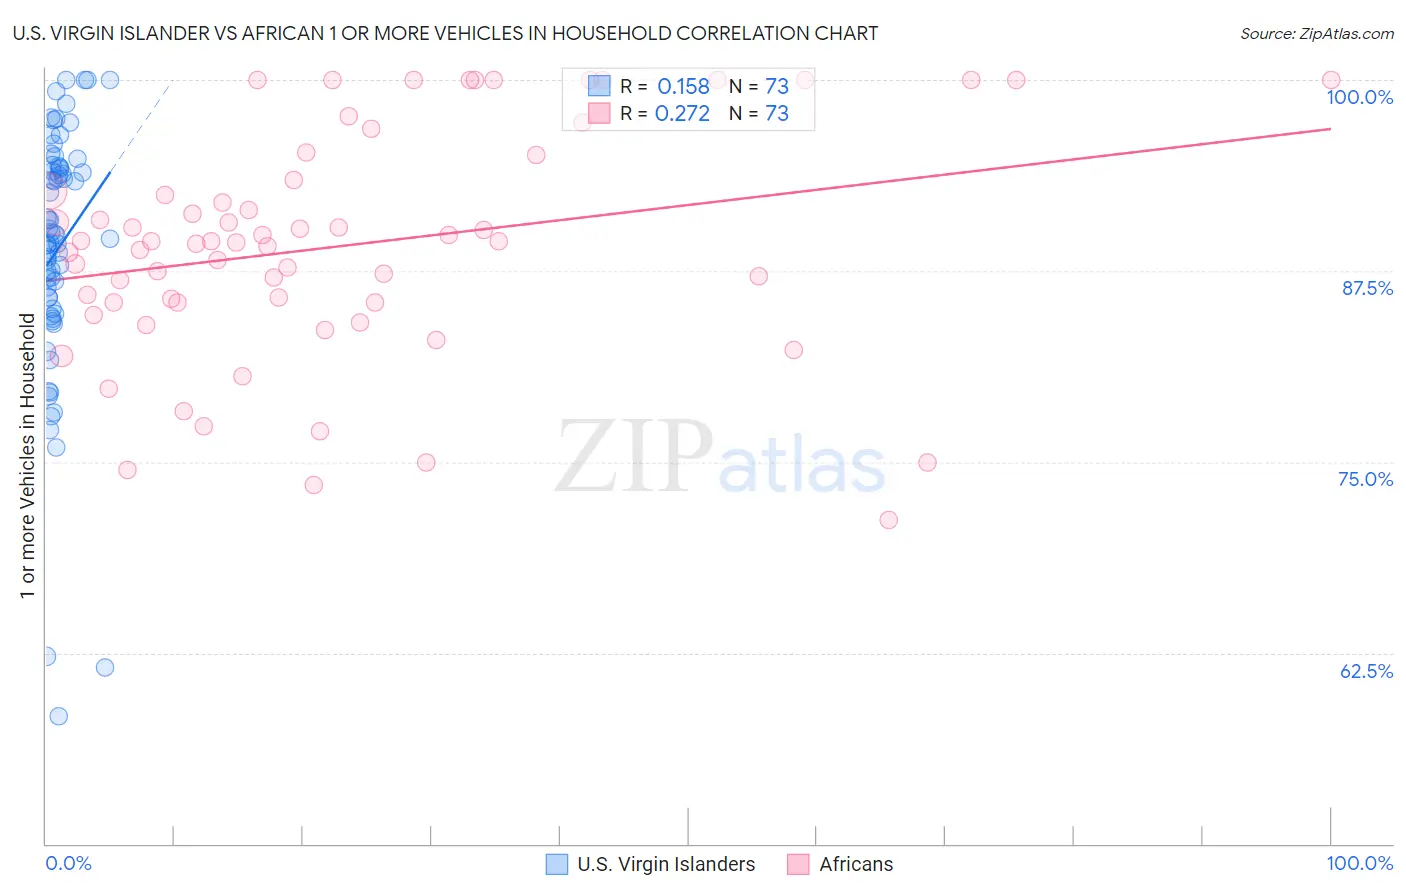
U.S. Virgin Islander vs African 1 or more Vehicles in Household Correlation Chart
The statistical analysis conducted on geographies consisting of 87,430,721 people shows a poor positive correlation between the proportion of U.S. Virgin Islanders and percentage of households with 1 or more vehicles available in the United States with a correlation coefficient (R) of 0.158 and weighted average of 84.6%. Similarly, the statistical analysis conducted on geographies consisting of 469,659,613 people shows a weak positive correlation between the proportion of Africans and percentage of households with 1 or more vehicles available in the United States with a correlation coefficient (R) of 0.272 and weighted average of 87.8%, a difference of 3.7%.
1 or more Vehicles in Household Correlation Summary
| Measurement | U.S. Virgin Islander | African |
| Minimum | 58.3% | 71.2% |
| Maximum | 100.0% | 100.0% |
| Range | 41.7% | 28.8% |
| Mean | 88.9% | 89.2% |
| Median | 89.9% | 89.4% |
| Interquartile 25% (IQ1) | 85.4% | 85.4% |
| Interquartile 75% (IQ3) | 94.3% | 94.3% |
| Interquartile Range (IQR) | 8.9% | 8.9% |
| Standard Deviation (Sample) | 8.4% | 7.4% |
| Standard Deviation (Population) | 8.3% | 7.4% |
Similar Demographics by 1 or more Vehicles in Household
Demographics Similar to U.S. Virgin Islanders by 1 or more Vehicles in Household
In terms of 1 or more vehicles in household, the demographic groups most similar to U.S. Virgin Islanders are Immigrants from Haiti (84.7%, a difference of 0.030%), Immigrants from Belize (84.7%, a difference of 0.040%), Puerto Rican (84.6%, a difference of 0.040%), Tohono O'odham (84.7%, a difference of 0.070%), and Cape Verdean (84.5%, a difference of 0.15%).
| Demographics | Rating | Rank | 1 or more Vehicles in Household |
| Immigrants | Greece | 0.0 /100 | #303 | Tragic 85.4% |
| Immigrants | Ukraine | 0.0 /100 | #304 | Tragic 85.2% |
| Immigrants | China | 0.0 /100 | #305 | Tragic 84.9% |
| Immigrants | Western Africa | 0.0 /100 | #306 | Tragic 84.9% |
| Tohono O'odham | 0.0 /100 | #307 | Tragic 84.7% |
| Immigrants | Belize | 0.0 /100 | #308 | Tragic 84.7% |
| Immigrants | Haiti | 0.0 /100 | #309 | Tragic 84.7% |
| U.S. Virgin Islanders | 0.0 /100 | #310 | Tragic 84.6% |
| Puerto Ricans | 0.0 /100 | #311 | Tragic 84.6% |
| Cape Verdeans | 0.0 /100 | #312 | Tragic 84.5% |
| Immigrants | Israel | 0.0 /100 | #313 | Tragic 84.5% |
| Albanians | 0.0 /100 | #314 | Tragic 84.4% |
| Cypriots | 0.0 /100 | #315 | Tragic 84.4% |
| Alaska Natives | 0.0 /100 | #316 | Tragic 83.8% |
| Ghanaians | 0.0 /100 | #317 | Tragic 83.6% |
Demographics Similar to Africans by 1 or more Vehicles in Household
In terms of 1 or more vehicles in household, the demographic groups most similar to Africans are Immigrants from Liberia (87.8%, a difference of 0.020%), Immigrants from Egypt (87.8%, a difference of 0.040%), Subsaharan African (87.9%, a difference of 0.11%), Immigrants from Switzerland (87.9%, a difference of 0.14%), and Israeli (87.7%, a difference of 0.14%).
| Demographics | Rating | Rank | 1 or more Vehicles in Household |
| South American Indians | 0.9 /100 | #258 | Tragic 88.0% |
| Nigerians | 0.8 /100 | #259 | Tragic 88.0% |
| Macedonians | 0.6 /100 | #260 | Tragic 87.9% |
| Immigrants | Switzerland | 0.6 /100 | #261 | Tragic 87.9% |
| Sub-Saharan Africans | 0.5 /100 | #262 | Tragic 87.9% |
| Immigrants | Egypt | 0.5 /100 | #263 | Tragic 87.8% |
| Immigrants | Liberia | 0.4 /100 | #264 | Tragic 87.8% |
| Africans | 0.4 /100 | #265 | Tragic 87.8% |
| Israelis | 0.3 /100 | #266 | Tragic 87.7% |
| Immigrants | Colombia | 0.3 /100 | #267 | Tragic 87.6% |
| Immigrants | Europe | 0.2 /100 | #268 | Tragic 87.6% |
| Immigrants | Africa | 0.2 /100 | #269 | Tragic 87.6% |
| Panamanians | 0.2 /100 | #270 | Tragic 87.5% |
| Bermudans | 0.2 /100 | #271 | Tragic 87.5% |
| Aleuts | 0.2 /100 | #272 | Tragic 87.5% |