Guatemalan vs Iranian In Labor Force | Age 16-19
COMPARE
Guatemalan
Iranian
In Labor Force | Age 16-19
In Labor Force | Age 16-19 Comparison
Guatemalans
Iranians
35.5%
IN LABOR FORCE | AGE 16-19
8.6/ 100
METRIC RATING
219th/ 347
METRIC RANK
33.0%
IN LABOR FORCE | AGE 16-19
0.0/ 100
METRIC RATING
298th/ 347
METRIC RANK
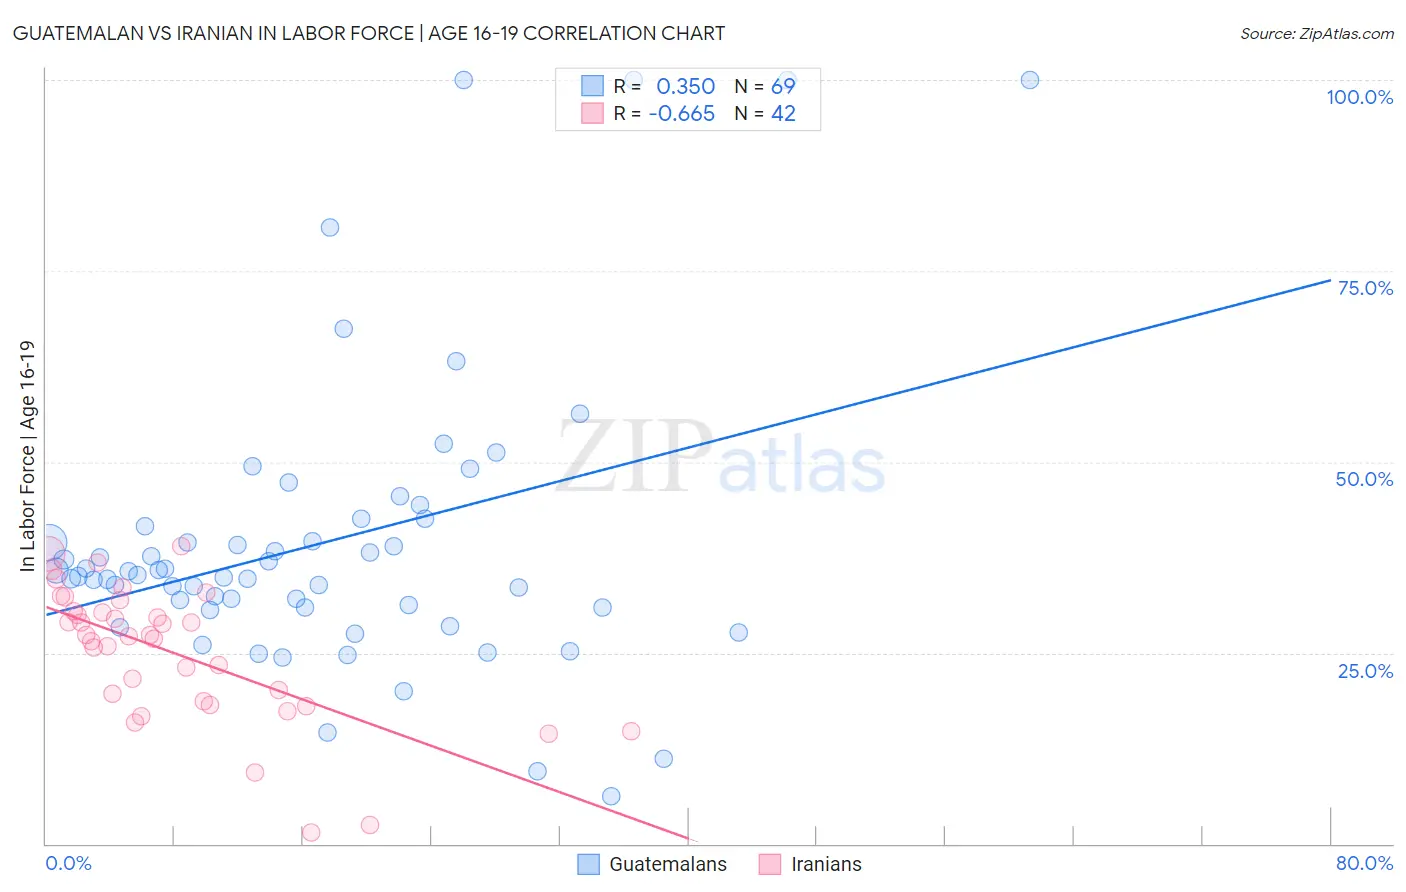
Guatemalan vs Iranian In Labor Force | Age 16-19 Correlation Chart
The statistical analysis conducted on geographies consisting of 409,132,504 people shows a mild positive correlation between the proportion of Guatemalans and labor force participation rate among population between the ages 16 and 19 in the United States with a correlation coefficient (R) of 0.350 and weighted average of 35.5%. Similarly, the statistical analysis conducted on geographies consisting of 316,490,712 people shows a significant negative correlation between the proportion of Iranians and labor force participation rate among population between the ages 16 and 19 in the United States with a correlation coefficient (R) of -0.665 and weighted average of 33.0%, a difference of 7.5%.
In Labor Force | Age 16-19 Correlation Summary
| Measurement | Guatemalan | Iranian |
| Minimum | 6.3% | 1.4% |
| Maximum | 100.0% | 39.0% |
| Range | 93.7% | 37.6% |
| Mean | 39.5% | 25.1% |
| Median | 35.2% | 27.2% |
| Interquartile 25% (IQ1) | 30.9% | 18.6% |
| Interquartile 75% (IQ3) | 42.1% | 30.5% |
| Interquartile Range (IQR) | 11.2% | 11.9% |
| Standard Deviation (Sample) | 19.2% | 8.8% |
| Standard Deviation (Population) | 19.1% | 8.7% |
Similar Demographics by In Labor Force | Age 16-19
Demographics Similar to Guatemalans by In Labor Force | Age 16-19
In terms of in labor force | age 16-19, the demographic groups most similar to Guatemalans are Immigrants from Bahamas (35.5%, a difference of 0.060%), Sri Lankan (35.5%, a difference of 0.18%), Turkish (35.4%, a difference of 0.23%), Immigrants from Ghana (35.4%, a difference of 0.24%), and Dutch West Indian (35.6%, a difference of 0.30%).
| Demographics | Rating | Rank | In Labor Force | Age 16-19 |
| Houma | 11.0 /100 | #212 | Poor 35.6% |
| Immigrants | Bolivia | 11.0 /100 | #213 | Poor 35.6% |
| Apache | 11.0 /100 | #214 | Poor 35.6% |
| Immigrants | South Eastern Asia | 10.8 /100 | #215 | Poor 35.6% |
| Dutch West Indians | 10.7 /100 | #216 | Poor 35.6% |
| Immigrants | Costa Rica | 10.7 /100 | #217 | Poor 35.6% |
| Sri Lankans | 9.8 /100 | #218 | Tragic 35.5% |
| Guatemalans | 8.6 /100 | #219 | Tragic 35.5% |
| Immigrants | Bahamas | 8.3 /100 | #220 | Tragic 35.5% |
| Turks | 7.3 /100 | #221 | Tragic 35.4% |
| Immigrants | Ghana | 7.3 /100 | #222 | Tragic 35.4% |
| Ghanaians | 6.5 /100 | #223 | Tragic 35.3% |
| Hondurans | 6.5 /100 | #224 | Tragic 35.3% |
| Immigrants | Belgium | 6.1 /100 | #225 | Tragic 35.3% |
| Immigrants | Guatemala | 5.7 /100 | #226 | Tragic 35.3% |
Demographics Similar to Iranians by In Labor Force | Age 16-19
In terms of in labor force | age 16-19, the demographic groups most similar to Iranians are Armenian (32.9%, a difference of 0.24%), Immigrants from Argentina (32.9%, a difference of 0.40%), Immigrants from Haiti (33.2%, a difference of 0.51%), Jamaican (33.2%, a difference of 0.60%), and Okinawan (32.8%, a difference of 0.63%).
| Demographics | Rating | Rank | In Labor Force | Age 16-19 |
| Immigrants | Belarus | 0.1 /100 | #291 | Tragic 33.4% |
| Haitians | 0.1 /100 | #292 | Tragic 33.4% |
| Immigrants | South America | 0.1 /100 | #293 | Tragic 33.3% |
| Argentineans | 0.1 /100 | #294 | Tragic 33.3% |
| Yup'ik | 0.1 /100 | #295 | Tragic 33.3% |
| Jamaicans | 0.1 /100 | #296 | Tragic 33.2% |
| Immigrants | Haiti | 0.1 /100 | #297 | Tragic 33.2% |
| Iranians | 0.0 /100 | #298 | Tragic 33.0% |
| Armenians | 0.0 /100 | #299 | Tragic 32.9% |
| Immigrants | Argentina | 0.0 /100 | #300 | Tragic 32.9% |
| Okinawans | 0.0 /100 | #301 | Tragic 32.8% |
| Belizeans | 0.0 /100 | #302 | Tragic 32.8% |
| Immigrants | Dominica | 0.0 /100 | #303 | Tragic 32.5% |
| Israelis | 0.0 /100 | #304 | Tragic 32.4% |
| Nicaraguans | 0.0 /100 | #305 | Tragic 32.4% |