German vs Immigrants from Ethiopia Associate's Degree
COMPARE
German
Immigrants from Ethiopia
Associate's Degree
Associate's Degree Comparison
Germans
Immigrants from Ethiopia
45.5%
ASSOCIATE'S DEGREE
26.5/ 100
METRIC RATING
195th/ 347
METRIC RANK
50.1%
ASSOCIATE'S DEGREE
98.7/ 100
METRIC RATING
90th/ 347
METRIC RANK
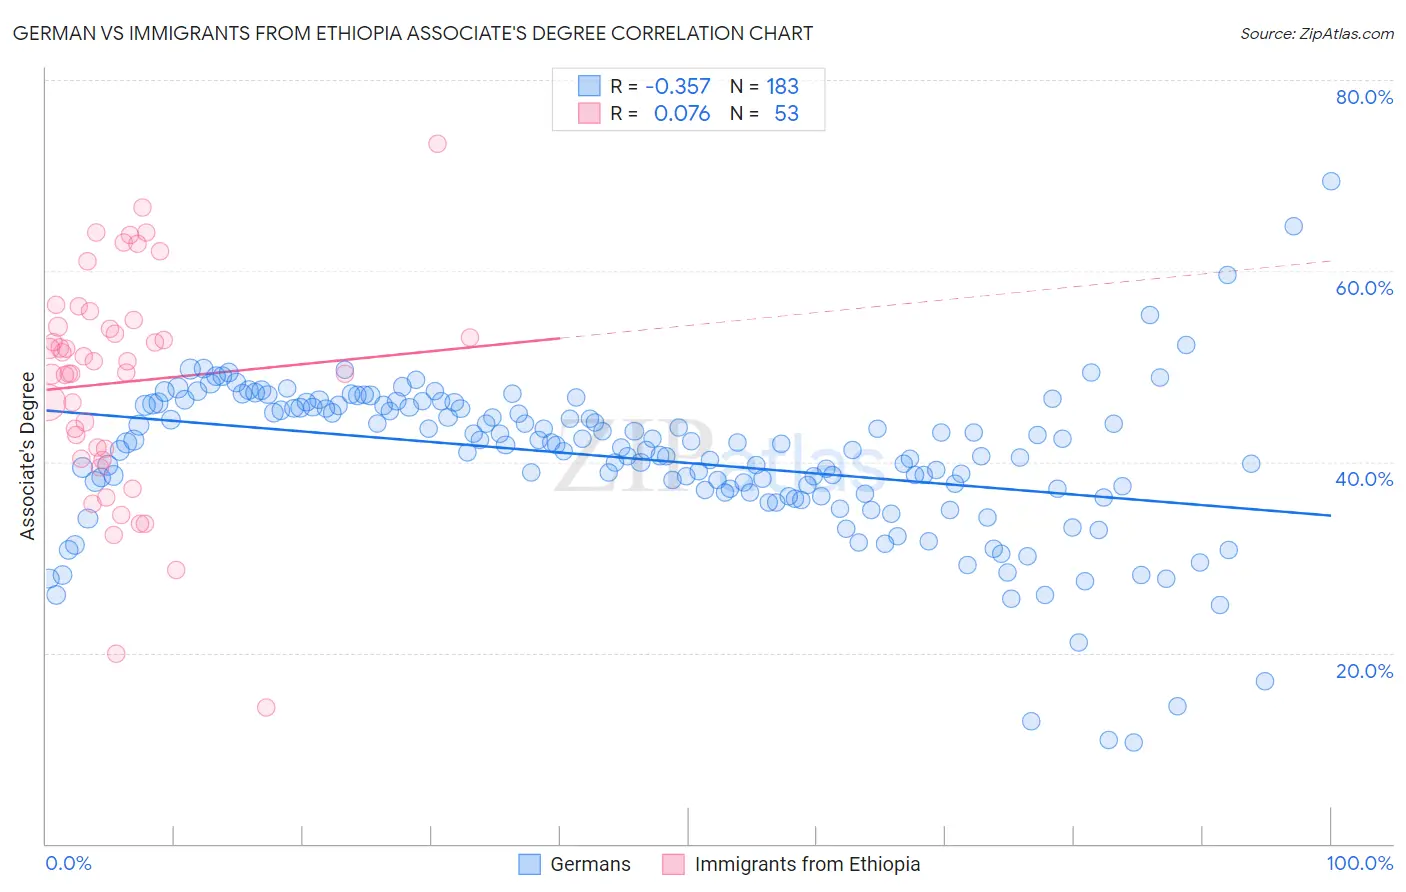
German vs Immigrants from Ethiopia Associate's Degree Correlation Chart
The statistical analysis conducted on geographies consisting of 581,143,634 people shows a mild negative correlation between the proportion of Germans and percentage of population with at least associate's degree education in the United States with a correlation coefficient (R) of -0.357 and weighted average of 45.5%. Similarly, the statistical analysis conducted on geographies consisting of 211,548,755 people shows a slight positive correlation between the proportion of Immigrants from Ethiopia and percentage of population with at least associate's degree education in the United States with a correlation coefficient (R) of 0.076 and weighted average of 50.1%, a difference of 10.2%.
Associate's Degree Correlation Summary
| Measurement | German | Immigrants from Ethiopia |
| Minimum | 10.6% | 14.3% |
| Maximum | 69.4% | 73.3% |
| Range | 58.8% | 59.0% |
| Mean | 40.3% | 48.3% |
| Median | 41.8% | 50.5% |
| Interquartile 25% (IQ1) | 36.7% | 40.9% |
| Interquartile 75% (IQ3) | 45.9% | 54.5% |
| Interquartile Range (IQR) | 9.2% | 13.7% |
| Standard Deviation (Sample) | 8.3% | 11.6% |
| Standard Deviation (Population) | 8.3% | 11.5% |
Similar Demographics by Associate's Degree
Demographics Similar to Germans by Associate's Degree
In terms of associate's degree, the demographic groups most similar to Germans are French (45.4%, a difference of 0.090%), Immigrants from Peru (45.5%, a difference of 0.10%), Immigrants from Cameroon (45.7%, a difference of 0.42%), Scotch-Irish (45.3%, a difference of 0.44%), and Immigrants from Bangladesh (45.2%, a difference of 0.54%).
| Demographics | Rating | Rank | Associate's Degree |
| Ghanaians | 35.5 /100 | #188 | Fair 45.8% |
| Immigrants | Oceania | 34.7 /100 | #189 | Fair 45.8% |
| Vietnamese | 34.0 /100 | #190 | Fair 45.8% |
| Koreans | 33.8 /100 | #191 | Fair 45.8% |
| Celtics | 33.3 /100 | #192 | Fair 45.8% |
| Immigrants | Cameroon | 31.0 /100 | #193 | Fair 45.7% |
| Immigrants | Peru | 27.6 /100 | #194 | Fair 45.5% |
| Germans | 26.5 /100 | #195 | Fair 45.5% |
| French | 25.6 /100 | #196 | Fair 45.4% |
| Scotch-Irish | 22.3 /100 | #197 | Fair 45.3% |
| Immigrants | Bangladesh | 21.3 /100 | #198 | Fair 45.2% |
| Immigrants | Senegal | 21.2 /100 | #199 | Fair 45.2% |
| Senegalese | 21.1 /100 | #200 | Fair 45.2% |
| Immigrants | Vietnam | 20.8 /100 | #201 | Fair 45.2% |
| Spaniards | 20.4 /100 | #202 | Fair 45.2% |
Demographics Similar to Immigrants from Ethiopia by Associate's Degree
In terms of associate's degree, the demographic groups most similar to Immigrants from Ethiopia are Immigrants from Canada (50.1%, a difference of 0.010%), Immigrants from Western Europe (50.1%, a difference of 0.010%), Immigrants from Moldova (50.2%, a difference of 0.080%), Immigrants from Western Asia (50.1%, a difference of 0.080%), and Immigrants from North America (50.1%, a difference of 0.10%).
| Demographics | Rating | Rank | Associate's Degree |
| Immigrants | Uzbekistan | 98.9 /100 | #83 | Exceptional 50.3% |
| Immigrants | Hungary | 98.9 /100 | #84 | Exceptional 50.2% |
| Immigrants | Egypt | 98.9 /100 | #85 | Exceptional 50.2% |
| Immigrants | Croatia | 98.9 /100 | #86 | Exceptional 50.2% |
| Immigrants | Moldova | 98.8 /100 | #87 | Exceptional 50.2% |
| Immigrants | Canada | 98.7 /100 | #88 | Exceptional 50.1% |
| Immigrants | Western Europe | 98.7 /100 | #89 | Exceptional 50.1% |
| Immigrants | Ethiopia | 98.7 /100 | #90 | Exceptional 50.1% |
| Immigrants | Western Asia | 98.7 /100 | #91 | Exceptional 50.1% |
| Immigrants | North America | 98.7 /100 | #92 | Exceptional 50.1% |
| Immigrants | Brazil | 98.5 /100 | #93 | Exceptional 50.0% |
| Laotians | 98.4 /100 | #94 | Exceptional 49.9% |
| Immigrants | England | 98.0 /100 | #95 | Exceptional 49.7% |
| Romanians | 98.0 /100 | #96 | Exceptional 49.7% |
| Immigrants | Ukraine | 98.0 /100 | #97 | Exceptional 49.7% |