French American Indian vs Lumbee In Labor Force | Age 20-24
COMPARE
French American Indian
Lumbee
In Labor Force | Age 20-24
In Labor Force | Age 20-24 Comparison
French American Indians
Lumbee
76.8%
IN LABOR FORCE | AGE 20-24
99.8/ 100
METRIC RATING
68th/ 347
METRIC RANK
65.5%
IN LABOR FORCE | AGE 20-24
0.0/ 100
METRIC RATING
346th/ 347
METRIC RANK
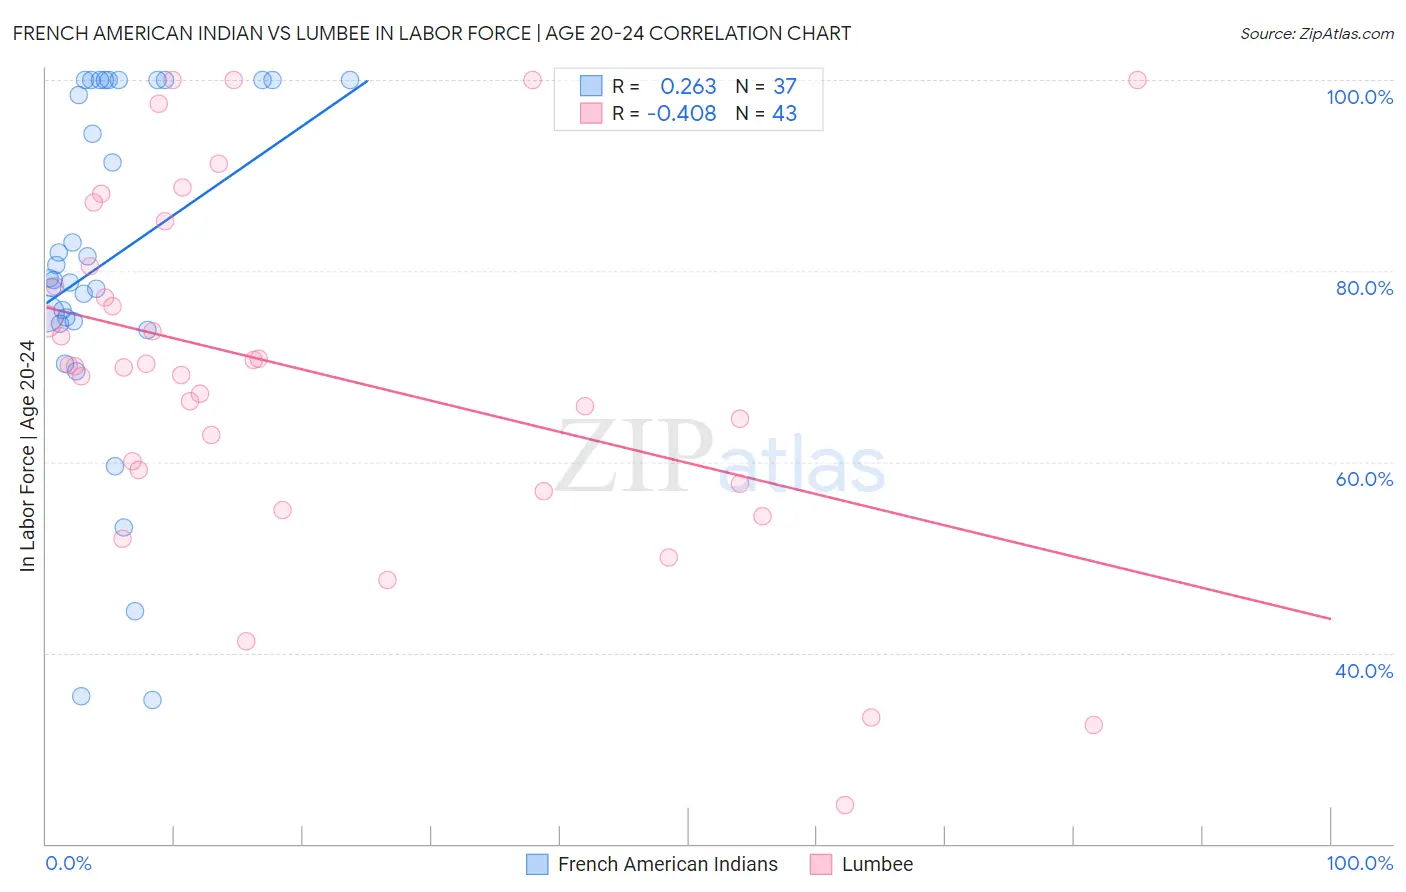
French American Indian vs Lumbee In Labor Force | Age 20-24 Correlation Chart
The statistical analysis conducted on geographies consisting of 131,958,584 people shows a weak positive correlation between the proportion of French American Indians and labor force participation rate among population between the ages 20 and 24 in the United States with a correlation coefficient (R) of 0.263 and weighted average of 76.8%. Similarly, the statistical analysis conducted on geographies consisting of 92,285,947 people shows a moderate negative correlation between the proportion of Lumbee and labor force participation rate among population between the ages 20 and 24 in the United States with a correlation coefficient (R) of -0.408 and weighted average of 65.5%, a difference of 17.3%.
In Labor Force | Age 20-24 Correlation Summary
| Measurement | French American Indian | Lumbee |
| Minimum | 35.1% | 24.0% |
| Maximum | 100.0% | 100.0% |
| Range | 64.9% | 76.0% |
| Mean | 81.1% | 69.3% |
| Median | 79.2% | 70.0% |
| Interquartile 25% (IQ1) | 74.6% | 57.7% |
| Interquartile 75% (IQ3) | 100.0% | 80.5% |
| Interquartile Range (IQR) | 25.4% | 22.8% |
| Standard Deviation (Sample) | 18.1% | 18.5% |
| Standard Deviation (Population) | 17.9% | 18.3% |
Similar Demographics by In Labor Force | Age 20-24
Demographics Similar to French American Indians by In Labor Force | Age 20-24
In terms of in labor force | age 20-24, the demographic groups most similar to French American Indians are Immigrants from Sudan (76.8%, a difference of 0.020%), Ottawa (76.8%, a difference of 0.030%), Icelander (76.9%, a difference of 0.040%), Slavic (76.9%, a difference of 0.040%), and Crow (76.9%, a difference of 0.060%).
| Demographics | Rating | Rank | In Labor Force | Age 20-24 |
| Immigrants | Eritrea | 99.9 /100 | #61 | Exceptional 77.0% |
| Immigrants | Kenya | 99.9 /100 | #62 | Exceptional 77.0% |
| Lithuanians | 99.9 /100 | #63 | Exceptional 77.0% |
| Whites/Caucasians | 99.9 /100 | #64 | Exceptional 76.9% |
| Crow | 99.9 /100 | #65 | Exceptional 76.9% |
| Icelanders | 99.9 /100 | #66 | Exceptional 76.9% |
| Slavs | 99.9 /100 | #67 | Exceptional 76.9% |
| French American Indians | 99.8 /100 | #68 | Exceptional 76.8% |
| Immigrants | Sudan | 99.8 /100 | #69 | Exceptional 76.8% |
| Ottawa | 99.8 /100 | #70 | Exceptional 76.8% |
| Northern Europeans | 99.8 /100 | #71 | Exceptional 76.8% |
| Guamanians/Chamorros | 99.8 /100 | #72 | Exceptional 76.7% |
| British | 99.8 /100 | #73 | Exceptional 76.7% |
| Cree | 99.7 /100 | #74 | Exceptional 76.6% |
| Immigrants | Middle Africa | 99.7 /100 | #75 | Exceptional 76.6% |
Demographics Similar to Lumbee by In Labor Force | Age 20-24
In terms of in labor force | age 20-24, the demographic groups most similar to Lumbee are Hopi (66.0%, a difference of 0.79%), Navajo (64.8%, a difference of 1.1%), Immigrants from Grenada (67.2%, a difference of 2.5%), Puerto Rican (68.3%, a difference of 4.3%), and Immigrants from St. Vincent and the Grenadines (68.4%, a difference of 4.4%).
| Demographics | Rating | Rank | In Labor Force | Age 20-24 |
| Yuman | 0.0 /100 | #333 | Tragic 70.3% |
| British West Indians | 0.0 /100 | #334 | Tragic 70.0% |
| Immigrants | Barbados | 0.0 /100 | #335 | Tragic 69.7% |
| Immigrants | Guyana | 0.0 /100 | #336 | Tragic 69.3% |
| Guyanese | 0.0 /100 | #337 | Tragic 69.2% |
| Pima | 0.0 /100 | #338 | Tragic 69.0% |
| Immigrants | Yemen | 0.0 /100 | #339 | Tragic 68.9% |
| Menominee | 0.0 /100 | #340 | Tragic 68.7% |
| Tohono O'odham | 0.0 /100 | #341 | Tragic 68.6% |
| Immigrants | St. Vincent and the Grenadines | 0.0 /100 | #342 | Tragic 68.4% |
| Puerto Ricans | 0.0 /100 | #343 | Tragic 68.3% |
| Immigrants | Grenada | 0.0 /100 | #344 | Tragic 67.2% |
| Hopi | 0.0 /100 | #345 | Tragic 66.0% |
| Lumbee | 0.0 /100 | #346 | Tragic 65.5% |
| Navajo | 0.0 /100 | #347 | Tragic 64.8% |