Iranian vs Lumbee 4 or more Vehicles in Household
COMPARE
Iranian
Lumbee
4 or more Vehicles in Household
4 or more Vehicles in Household Comparison
Iranians
Lumbee
6.5%
4 OR MORE VEHICLES IN HOUSEHOLD
69.9/ 100
METRIC RATING
156th/ 347
METRIC RANK
8.8%
4 OR MORE VEHICLES IN HOUSEHOLD
100.0/ 100
METRIC RATING
16th/ 347
METRIC RANK
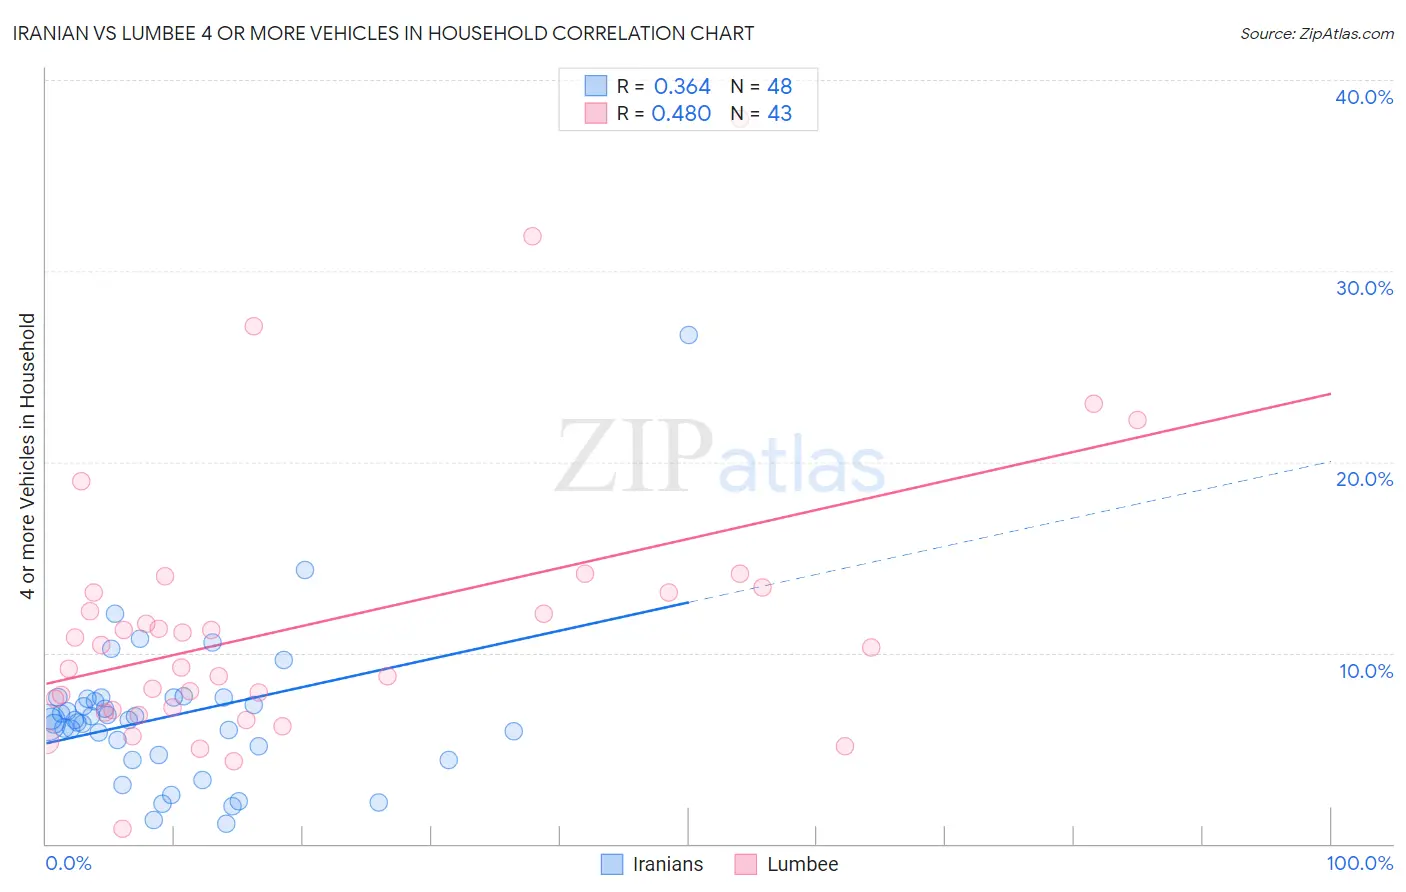
Iranian vs Lumbee 4 or more Vehicles in Household Correlation Chart
The statistical analysis conducted on geographies consisting of 315,200,253 people shows a mild positive correlation between the proportion of Iranians and percentage of households with 4 or more vehicles available in the United States with a correlation coefficient (R) of 0.364 and weighted average of 6.5%. Similarly, the statistical analysis conducted on geographies consisting of 92,195,503 people shows a moderate positive correlation between the proportion of Lumbee and percentage of households with 4 or more vehicles available in the United States with a correlation coefficient (R) of 0.480 and weighted average of 8.8%, a difference of 36.0%.
4 or more Vehicles in Household Correlation Summary
| Measurement | Iranian | Lumbee |
| Minimum | 1.1% | 0.79% |
| Maximum | 26.7% | 38.0% |
| Range | 25.6% | 37.2% |
| Mean | 6.7% | 11.6% |
| Median | 6.5% | 10.3% |
| Interquartile 25% (IQ1) | 4.9% | 7.0% |
| Interquartile 75% (IQ3) | 7.6% | 13.2% |
| Interquartile Range (IQR) | 2.7% | 6.2% |
| Standard Deviation (Sample) | 4.0% | 7.3% |
| Standard Deviation (Population) | 4.0% | 7.2% |
Similar Demographics by 4 or more Vehicles in Household
Demographics Similar to Iranians by 4 or more Vehicles in Household
In terms of 4 or more vehicles in household, the demographic groups most similar to Iranians are Peruvian (6.5%, a difference of 0.050%), Iroquois (6.5%, a difference of 0.060%), Central American Indian (6.5%, a difference of 0.14%), Immigrants from Armenia (6.5%, a difference of 0.16%), and Yuman (6.5%, a difference of 0.27%).
| Demographics | Rating | Rank | 4 or more Vehicles in Household |
| Greeks | 73.6 /100 | #149 | Good 6.5% |
| New Zealanders | 73.3 /100 | #150 | Good 6.5% |
| Immigrants | Hong Kong | 72.2 /100 | #151 | Good 6.5% |
| Yuman | 72.1 /100 | #152 | Good 6.5% |
| Immigrants | Armenia | 71.2 /100 | #153 | Good 6.5% |
| Central American Indians | 71.1 /100 | #154 | Good 6.5% |
| Iroquois | 70.4 /100 | #155 | Good 6.5% |
| Iranians | 69.9 /100 | #156 | Good 6.5% |
| Peruvians | 69.4 /100 | #157 | Good 6.5% |
| Zimbabweans | 67.1 /100 | #158 | Good 6.4% |
| Indians (Asian) | 66.3 /100 | #159 | Good 6.4% |
| Palestinians | 65.8 /100 | #160 | Good 6.4% |
| Immigrants | Cameroon | 64.4 /100 | #161 | Good 6.4% |
| Immigrants | Pakistan | 63.2 /100 | #162 | Good 6.4% |
| Chileans | 61.2 /100 | #163 | Good 6.4% |
Demographics Similar to Lumbee by 4 or more Vehicles in Household
In terms of 4 or more vehicles in household, the demographic groups most similar to Lumbee are Ute (8.8%, a difference of 0.33%), Nepalese (8.7%, a difference of 0.43%), Shoshone (8.8%, a difference of 0.71%), Chinese (8.8%, a difference of 0.74%), and Korean (8.6%, a difference of 1.6%).
| Demographics | Rating | Rank | 4 or more Vehicles in Household |
| Samoans | 100.0 /100 | #9 | Exceptional 9.2% |
| Paiute | 100.0 /100 | #10 | Exceptional 9.0% |
| Immigrants | Mexico | 100.0 /100 | #11 | Exceptional 9.0% |
| Mexicans | 100.0 /100 | #12 | Exceptional 8.9% |
| Hawaiians | 100.0 /100 | #13 | Exceptional 8.9% |
| Chinese | 100.0 /100 | #14 | Exceptional 8.8% |
| Shoshone | 100.0 /100 | #15 | Exceptional 8.8% |
| Lumbee | 100.0 /100 | #16 | Exceptional 8.8% |
| Ute | 100.0 /100 | #17 | Exceptional 8.8% |
| Nepalese | 100.0 /100 | #18 | Exceptional 8.7% |
| Koreans | 100.0 /100 | #19 | Exceptional 8.6% |
| Pueblo | 100.0 /100 | #20 | Exceptional 8.6% |
| Danes | 100.0 /100 | #21 | Exceptional 8.6% |
| Immigrants | Vietnam | 100.0 /100 | #22 | Exceptional 8.6% |
| Immigrants | Philippines | 100.0 /100 | #23 | Exceptional 8.5% |