Pakistani vs Bermudan 4 or more Vehicles in Household
COMPARE
Pakistani
Bermudan
4 or more Vehicles in Household
4 or more Vehicles in Household Comparison
Pakistanis
Bermudans
7.0%
4 OR MORE VEHICLES IN HOUSEHOLD
98.7/ 100
METRIC RATING
101st/ 347
METRIC RANK
5.6%
4 OR MORE VEHICLES IN HOUSEHOLD
1.2/ 100
METRIC RATING
262nd/ 347
METRIC RANK
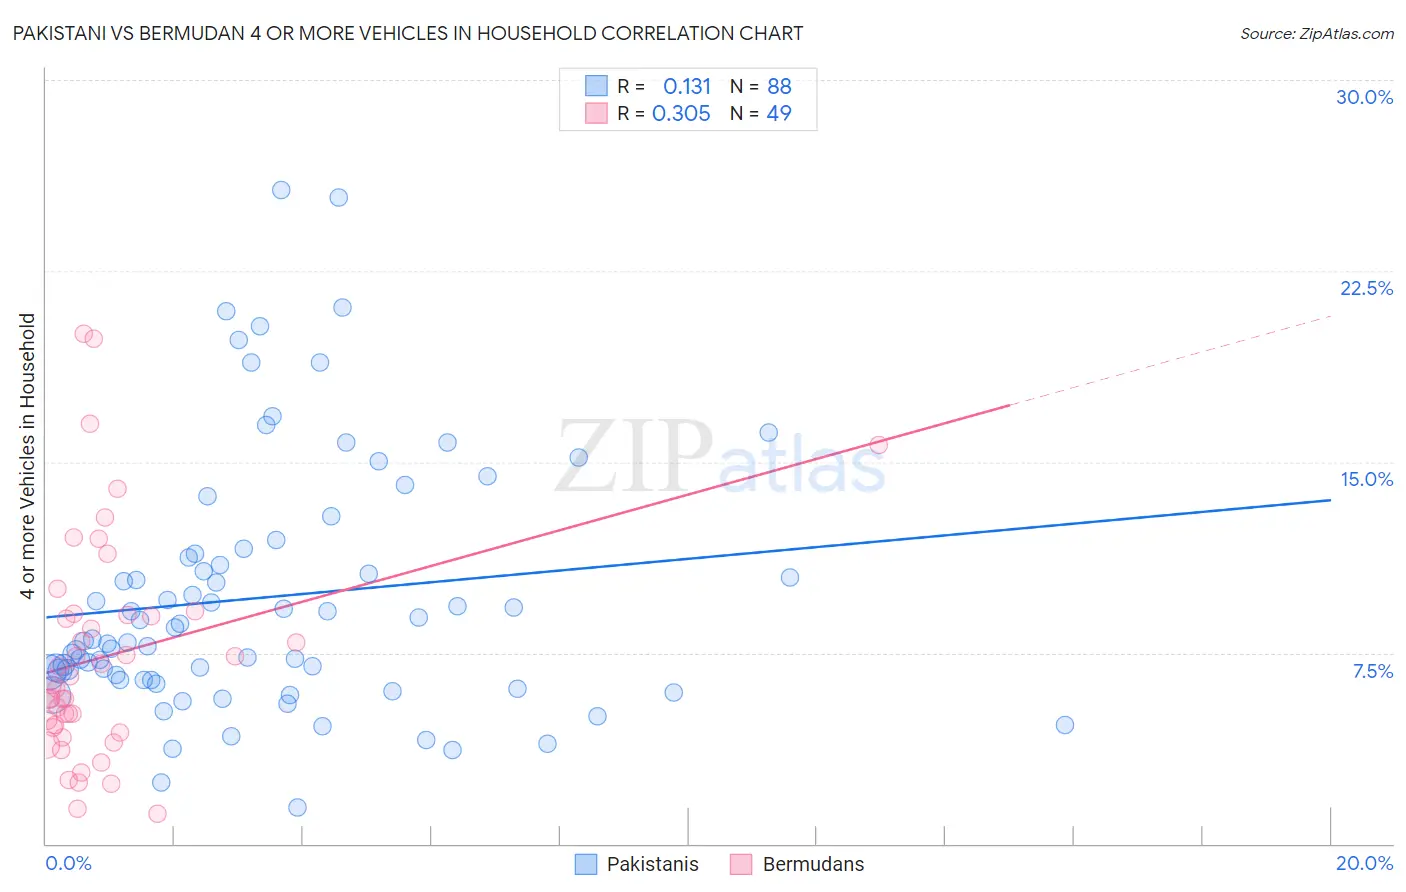
Pakistani vs Bermudan 4 or more Vehicles in Household Correlation Chart
The statistical analysis conducted on geographies consisting of 334,097,212 people shows a poor positive correlation between the proportion of Pakistanis and percentage of households with 4 or more vehicles available in the United States with a correlation coefficient (R) of 0.131 and weighted average of 7.0%. Similarly, the statistical analysis conducted on geographies consisting of 55,665,642 people shows a mild positive correlation between the proportion of Bermudans and percentage of households with 4 or more vehicles available in the United States with a correlation coefficient (R) of 0.305 and weighted average of 5.6%, a difference of 24.9%.
4 or more Vehicles in Household Correlation Summary
| Measurement | Pakistani | Bermudan |
| Minimum | 1.4% | 1.2% |
| Maximum | 25.7% | 20.0% |
| Range | 24.2% | 18.9% |
| Mean | 9.7% | 7.4% |
| Median | 8.0% | 6.2% |
| Interquartile 25% (IQ1) | 6.4% | 4.5% |
| Interquartile 75% (IQ3) | 11.3% | 9.0% |
| Interquartile Range (IQR) | 4.9% | 4.5% |
| Standard Deviation (Sample) | 5.0% | 4.4% |
| Standard Deviation (Population) | 5.0% | 4.3% |
Similar Demographics by 4 or more Vehicles in Household
Demographics Similar to Pakistanis by 4 or more Vehicles in Household
In terms of 4 or more vehicles in household, the demographic groups most similar to Pakistanis are Taiwanese (7.0%, a difference of 0.070%), Asian (7.0%, a difference of 0.070%), Blackfeet (7.0%, a difference of 0.080%), Seminole (7.0%, a difference of 0.15%), and Hmong (7.0%, a difference of 0.56%).
| Demographics | Rating | Rank | 4 or more Vehicles in Household |
| Dutch West Indians | 99.3 /100 | #94 | Exceptional 7.1% |
| Czechoslovakians | 99.3 /100 | #95 | Exceptional 7.1% |
| Central Americans | 99.3 /100 | #96 | Exceptional 7.1% |
| Celtics | 99.1 /100 | #97 | Exceptional 7.1% |
| Irish | 99.0 /100 | #98 | Exceptional 7.1% |
| Seminole | 98.8 /100 | #99 | Exceptional 7.0% |
| Taiwanese | 98.7 /100 | #100 | Exceptional 7.0% |
| Pakistanis | 98.7 /100 | #101 | Exceptional 7.0% |
| Asians | 98.6 /100 | #102 | Exceptional 7.0% |
| Blackfeet | 98.6 /100 | #103 | Exceptional 7.0% |
| Hmong | 98.3 /100 | #104 | Exceptional 7.0% |
| German Russians | 98.3 /100 | #105 | Exceptional 7.0% |
| Guatemalans | 98.1 /100 | #106 | Exceptional 7.0% |
| Nicaraguans | 98.0 /100 | #107 | Exceptional 7.0% |
| French | 97.7 /100 | #108 | Exceptional 6.9% |
Demographics Similar to Bermudans by 4 or more Vehicles in Household
In terms of 4 or more vehicles in household, the demographic groups most similar to Bermudans are Immigrants from Saudi Arabia (5.6%, a difference of 0.090%), Sudanese (5.6%, a difference of 0.11%), Uruguayan (5.6%, a difference of 0.20%), Immigrants from France (5.6%, a difference of 0.38%), and Immigrants from Lithuania (5.6%, a difference of 0.42%).
| Demographics | Rating | Rank | 4 or more Vehicles in Household |
| Yup'ik | 1.5 /100 | #255 | Tragic 5.7% |
| Immigrants | Turkey | 1.5 /100 | #256 | Tragic 5.7% |
| Immigrants | Northern Africa | 1.4 /100 | #257 | Tragic 5.6% |
| Immigrants | Lithuania | 1.4 /100 | #258 | Tragic 5.6% |
| Immigrants | France | 1.3 /100 | #259 | Tragic 5.6% |
| Uruguayans | 1.3 /100 | #260 | Tragic 5.6% |
| Sudanese | 1.2 /100 | #261 | Tragic 5.6% |
| Bermudans | 1.2 /100 | #262 | Tragic 5.6% |
| Immigrants | Saudi Arabia | 1.1 /100 | #263 | Tragic 5.6% |
| Immigrants | Africa | 1.0 /100 | #264 | Tragic 5.6% |
| South Americans | 0.9 /100 | #265 | Tragic 5.6% |
| Immigrants | Nepal | 0.9 /100 | #266 | Tragic 5.6% |
| Immigrants | Ukraine | 0.9 /100 | #267 | Tragic 5.6% |
| Colombians | 0.7 /100 | #268 | Tragic 5.5% |
| Carpatho Rusyns | 0.7 /100 | #269 | Tragic 5.5% |