French American Indian vs Bermudan Householder Income Under 25 years
COMPARE
French American Indian
Bermudan
Householder Income Under 25 years
Householder Income Under 25 years Comparison
French American Indians
Bermudans
$48,977
HOUSEHOLDER INCOME UNDER 25 YEARS
0.0/ 100
METRIC RATING
286th/ 347
METRIC RANK
$47,359
HOUSEHOLDER INCOME UNDER 25 YEARS
0.0/ 100
METRIC RATING
312th/ 347
METRIC RANK
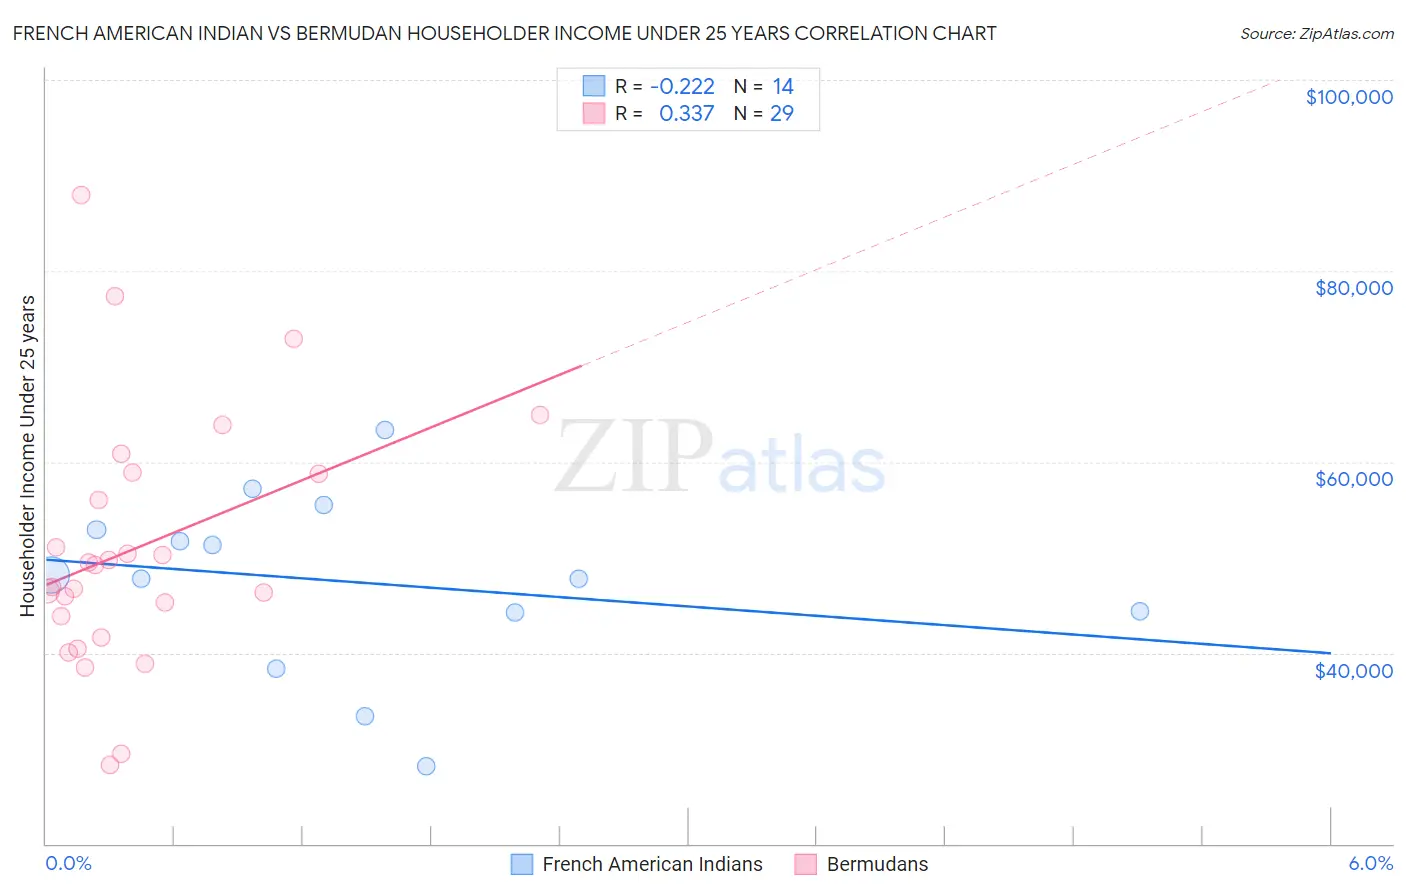
French American Indian vs Bermudan Householder Income Under 25 years Correlation Chart
The statistical analysis conducted on geographies consisting of 121,781,393 people shows a weak negative correlation between the proportion of French American Indians and household income with householder under the age of 25 in the United States with a correlation coefficient (R) of -0.222 and weighted average of $48,977. Similarly, the statistical analysis conducted on geographies consisting of 52,946,816 people shows a mild positive correlation between the proportion of Bermudans and household income with householder under the age of 25 in the United States with a correlation coefficient (R) of 0.337 and weighted average of $47,359, a difference of 3.4%.
Householder Income Under 25 years Correlation Summary
| Measurement | French American Indian | Bermudan |
| Minimum | $28,139 | $28,306 |
| Maximum | $63,296 | $87,995 |
| Range | $35,157 | $59,689 |
| Mean | $47,414 | $51,037 |
| Median | $47,997 | $49,161 |
| Interquartile 25% (IQ1) | $44,202 | $42,763 |
| Interquartile 75% (IQ3) | $52,866 | $58,788 |
| Interquartile Range (IQR) | $8,663 | $16,024 |
| Standard Deviation (Sample) | $9,404 | $13,290 |
| Standard Deviation (Population) | $9,062 | $13,059 |
Similar Demographics by Householder Income Under 25 years
Demographics Similar to French American Indians by Householder Income Under 25 years
In terms of householder income under 25 years, the demographic groups most similar to French American Indians are Senegalese ($48,953, a difference of 0.050%), Liberian ($48,917, a difference of 0.12%), Scotch-Irish ($49,039, a difference of 0.13%), Honduran ($48,885, a difference of 0.19%), and American ($48,860, a difference of 0.24%).
| Demographics | Rating | Rank | Householder Income Under 25 years |
| Apache | 0.1 /100 | #279 | Tragic $49,395 |
| Hmong | 0.1 /100 | #280 | Tragic $49,364 |
| Immigrants | Nonimmigrants | 0.1 /100 | #281 | Tragic $49,348 |
| Alsatians | 0.1 /100 | #282 | Tragic $49,267 |
| Immigrants | Nigeria | 0.1 /100 | #283 | Tragic $49,174 |
| Carpatho Rusyns | 0.1 /100 | #284 | Tragic $49,113 |
| Scotch-Irish | 0.0 /100 | #285 | Tragic $49,039 |
| French American Indians | 0.0 /100 | #286 | Tragic $48,977 |
| Senegalese | 0.0 /100 | #287 | Tragic $48,953 |
| Liberians | 0.0 /100 | #288 | Tragic $48,917 |
| Hondurans | 0.0 /100 | #289 | Tragic $48,885 |
| Americans | 0.0 /100 | #290 | Tragic $48,860 |
| Immigrants | Burma/Myanmar | 0.0 /100 | #291 | Tragic $48,749 |
| Shoshone | 0.0 /100 | #292 | Tragic $48,720 |
| Sub-Saharan Africans | 0.0 /100 | #293 | Tragic $48,691 |
Demographics Similar to Bermudans by Householder Income Under 25 years
In terms of householder income under 25 years, the demographic groups most similar to Bermudans are Ottawa ($47,366, a difference of 0.010%), Iroquois ($47,380, a difference of 0.040%), U.S. Virgin Islander ($47,448, a difference of 0.19%), Comanche ($47,518, a difference of 0.34%), and Delaware ($47,159, a difference of 0.43%).
| Demographics | Rating | Rank | Householder Income Under 25 years |
| Cherokee | 0.0 /100 | #305 | Tragic $47,848 |
| Natives/Alaskans | 0.0 /100 | #306 | Tragic $47,704 |
| Bangladeshis | 0.0 /100 | #307 | Tragic $47,589 |
| Comanche | 0.0 /100 | #308 | Tragic $47,518 |
| U.S. Virgin Islanders | 0.0 /100 | #309 | Tragic $47,448 |
| Iroquois | 0.0 /100 | #310 | Tragic $47,380 |
| Ottawa | 0.0 /100 | #311 | Tragic $47,366 |
| Bermudans | 0.0 /100 | #312 | Tragic $47,359 |
| Delaware | 0.0 /100 | #313 | Tragic $47,159 |
| Chippewa | 0.0 /100 | #314 | Tragic $47,015 |
| Crow | 0.0 /100 | #315 | Tragic $47,012 |
| Sudanese | 0.0 /100 | #316 | Tragic $46,982 |
| Hopi | 0.0 /100 | #317 | Tragic $46,978 |
| Spanish Americans | 0.0 /100 | #318 | Tragic $46,913 |
| Africans | 0.0 /100 | #319 | Tragic $46,838 |