Filipino vs Immigrants from Zaire Per Capita Income
COMPARE
Filipino
Immigrants from Zaire
Per Capita Income
Per Capita Income Comparison
Filipinos
Immigrants from Zaire
$59,066
PER CAPITA INCOME
100.0/ 100
METRIC RATING
1st/ 347
METRIC RANK
$38,848
PER CAPITA INCOME
0.4/ 100
METRIC RATING
267th/ 347
METRIC RANK
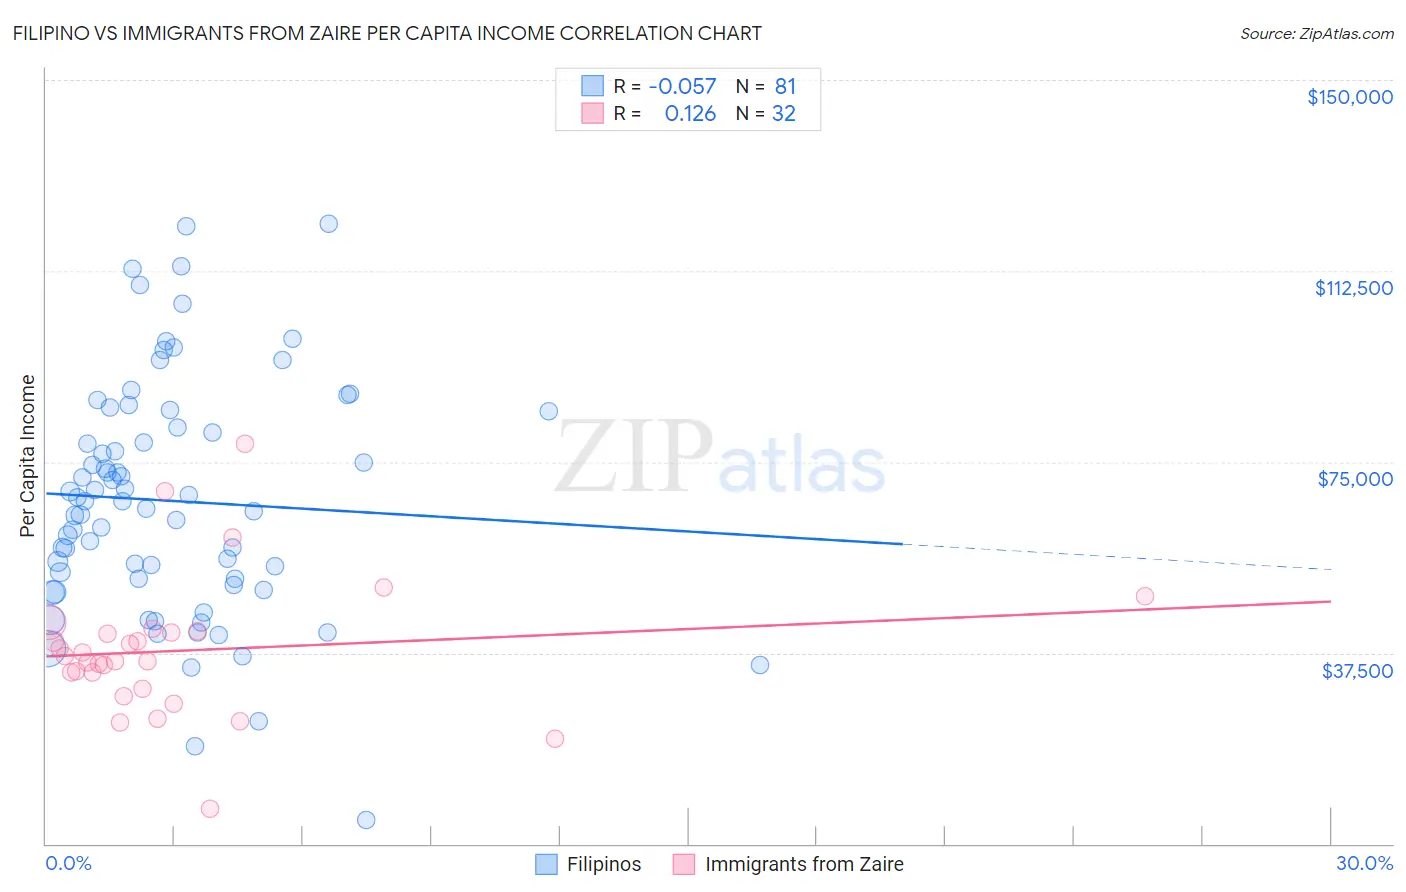
Filipino vs Immigrants from Zaire Per Capita Income Correlation Chart
The statistical analysis conducted on geographies consisting of 254,359,894 people shows a slight negative correlation between the proportion of Filipinos and per capita income in the United States with a correlation coefficient (R) of -0.057 and weighted average of $59,066. Similarly, the statistical analysis conducted on geographies consisting of 107,255,805 people shows a poor positive correlation between the proportion of Immigrants from Zaire and per capita income in the United States with a correlation coefficient (R) of 0.126 and weighted average of $38,848, a difference of 52.0%.
Per Capita Income Correlation Summary
| Measurement | Filipino | Immigrants from Zaire |
| Minimum | $4,657 | $6,803 |
| Maximum | $121,798 | $78,629 |
| Range | $117,141 | $71,826 |
| Mean | $67,314 | $37,941 |
| Median | $67,249 | $36,388 |
| Interquartile 25% (IQ1) | $51,364 | $32,029 |
| Interquartile 75% (IQ3) | $83,421 | $41,659 |
| Interquartile Range (IQR) | $32,057 | $9,630 |
| Standard Deviation (Sample) | $23,294 | $13,517 |
| Standard Deviation (Population) | $23,149 | $13,304 |
Similar Demographics by Per Capita Income
Demographics Similar to Filipinos by Per Capita Income
In terms of per capita income, the demographic groups most similar to Filipinos are Iranian ($58,786, a difference of 0.48%), Immigrants from Singapore ($58,353, a difference of 1.2%), Immigrants from Australia ($57,953, a difference of 1.9%), Immigrants from Iran ($57,759, a difference of 2.3%), and Immigrants from Taiwan ($57,742, a difference of 2.3%).
| Demographics | Rating | Rank | Per Capita Income |
| Filipinos | 100.0 /100 | #1 | Exceptional $59,066 |
| Iranians | 100.0 /100 | #2 | Exceptional $58,786 |
| Immigrants | Singapore | 100.0 /100 | #3 | Exceptional $58,353 |
| Immigrants | Australia | 100.0 /100 | #4 | Exceptional $57,953 |
| Immigrants | Iran | 100.0 /100 | #5 | Exceptional $57,759 |
| Immigrants | Taiwan | 100.0 /100 | #6 | Exceptional $57,742 |
| Immigrants | Israel | 100.0 /100 | #7 | Exceptional $57,384 |
| Immigrants | Hong Kong | 100.0 /100 | #8 | Exceptional $56,709 |
| Immigrants | Ireland | 100.0 /100 | #9 | Exceptional $56,584 |
| Okinawans | 100.0 /100 | #10 | Exceptional $55,817 |
| Eastern Europeans | 100.0 /100 | #11 | Exceptional $55,780 |
| Immigrants | Sweden | 100.0 /100 | #12 | Exceptional $55,582 |
| Immigrants | India | 100.0 /100 | #13 | Exceptional $55,268 |
| Immigrants | Belgium | 100.0 /100 | #14 | Exceptional $55,082 |
| Cypriots | 100.0 /100 | #15 | Exceptional $54,899 |
Demographics Similar to Immigrants from Zaire by Per Capita Income
In terms of per capita income, the demographic groups most similar to Immigrants from Zaire are Salvadoran ($38,858, a difference of 0.030%), Liberian ($38,780, a difference of 0.17%), Immigrants from Jamaica ($38,766, a difference of 0.21%), Spanish American ($39,012, a difference of 0.42%), and American ($39,039, a difference of 0.49%).
| Demographics | Rating | Rank | Per Capita Income |
| Alaskan Athabascans | 0.6 /100 | #260 | Tragic $39,163 |
| Marshallese | 0.6 /100 | #261 | Tragic $39,108 |
| Iroquois | 0.6 /100 | #262 | Tragic $39,104 |
| Belizeans | 0.6 /100 | #263 | Tragic $39,097 |
| Americans | 0.6 /100 | #264 | Tragic $39,039 |
| Spanish Americans | 0.5 /100 | #265 | Tragic $39,012 |
| Salvadorans | 0.5 /100 | #266 | Tragic $38,858 |
| Immigrants | Zaire | 0.4 /100 | #267 | Tragic $38,848 |
| Liberians | 0.4 /100 | #268 | Tragic $38,780 |
| Immigrants | Jamaica | 0.4 /100 | #269 | Tragic $38,766 |
| Immigrants | Belize | 0.3 /100 | #270 | Tragic $38,614 |
| Central Americans | 0.3 /100 | #271 | Tragic $38,560 |
| Immigrants | Cabo Verde | 0.3 /100 | #272 | Tragic $38,540 |
| Nepalese | 0.3 /100 | #273 | Tragic $38,442 |
| Immigrants | El Salvador | 0.3 /100 | #274 | Tragic $38,394 |