Honduran vs Immigrants from Bahamas No Vehicles in Household
COMPARE
Honduran
Immigrants from Bahamas
No Vehicles in Household
No Vehicles in Household Comparison
Hondurans
Immigrants from Bahamas
12.0%
NO VEHICLES IN HOUSEHOLD
1.2/ 100
METRIC RATING
255th/ 347
METRIC RANK
9.9%
NO VEHICLES IN HOUSEHOLD
81.2/ 100
METRIC RATING
144th/ 347
METRIC RANK
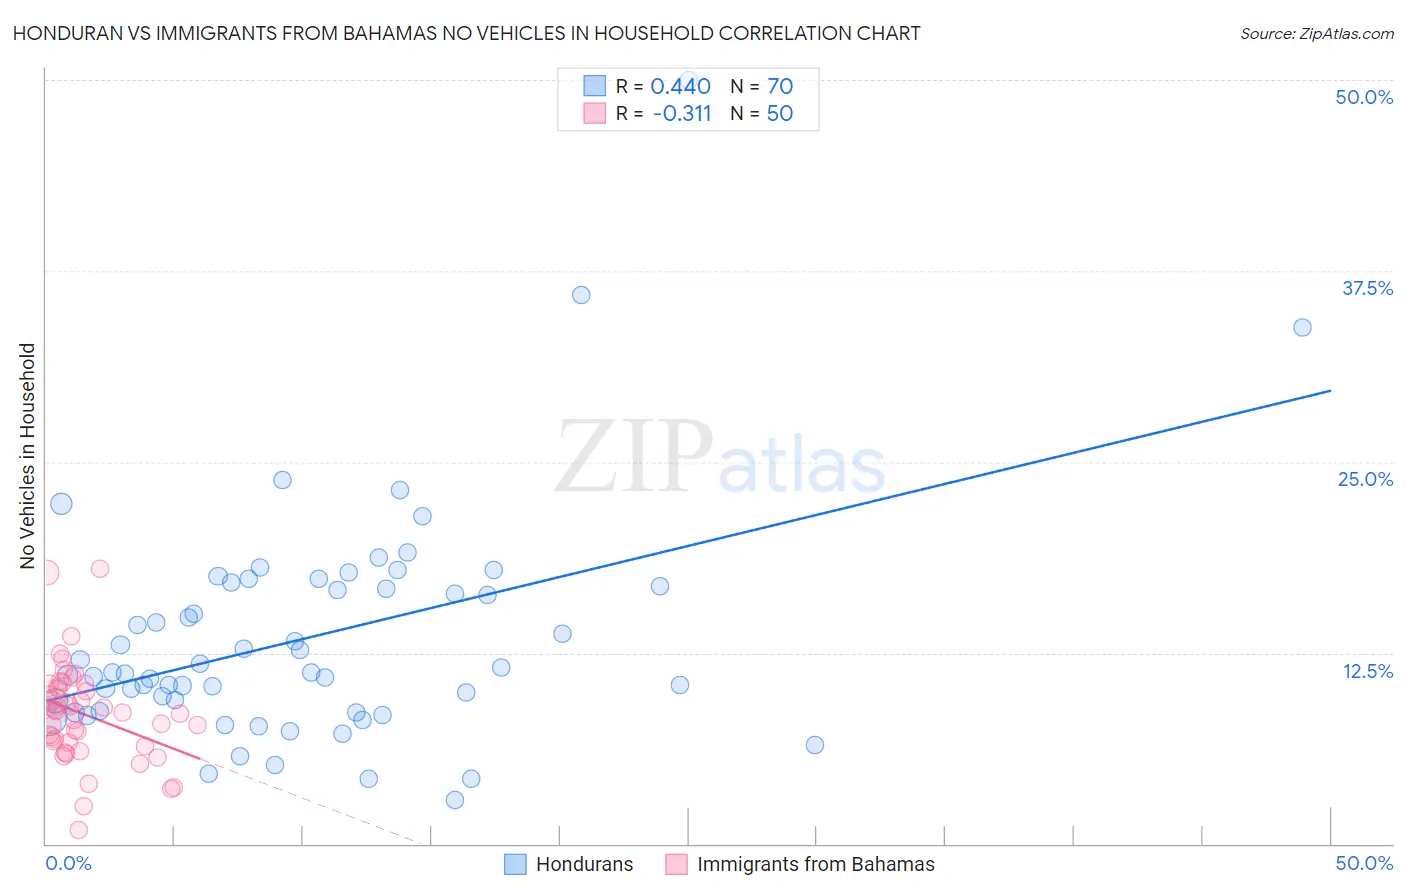
Honduran vs Immigrants from Bahamas No Vehicles in Household Correlation Chart
The statistical analysis conducted on geographies consisting of 357,165,366 people shows a moderate positive correlation between the proportion of Hondurans and percentage of households with no vehicle available in the United States with a correlation coefficient (R) of 0.440 and weighted average of 12.0%. Similarly, the statistical analysis conducted on geographies consisting of 104,565,234 people shows a mild negative correlation between the proportion of Immigrants from Bahamas and percentage of households with no vehicle available in the United States with a correlation coefficient (R) of -0.311 and weighted average of 9.9%, a difference of 21.0%.
No Vehicles in Household Correlation Summary
| Measurement | Honduran | Immigrants from Bahamas |
| Minimum | 2.9% | 0.94% |
| Maximum | 50.0% | 18.0% |
| Range | 47.1% | 17.1% |
| Mean | 13.4% | 8.5% |
| Median | 11.2% | 8.6% |
| Interquartile 25% (IQ1) | 8.7% | 6.6% |
| Interquartile 75% (IQ3) | 16.8% | 10.2% |
| Interquartile Range (IQR) | 8.1% | 3.6% |
| Standard Deviation (Sample) | 7.5% | 3.2% |
| Standard Deviation (Population) | 7.5% | 3.2% |
Similar Demographics by No Vehicles in Household
Demographics Similar to Hondurans by No Vehicles in Household
In terms of no vehicles in household, the demographic groups most similar to Hondurans are Liberian (12.0%, a difference of 0.050%), Immigrants from Uruguay (11.9%, a difference of 0.27%), Egyptian (11.9%, a difference of 0.59%), Immigrants from Serbia (11.9%, a difference of 0.66%), and Nigerian (12.1%, a difference of 0.79%).
| Demographics | Rating | Rank | No Vehicles in Household |
| Immigrants | Belgium | 1.9 /100 | #248 | Tragic 11.8% |
| Immigrants | Nigeria | 1.9 /100 | #249 | Tragic 11.8% |
| Paiute | 1.8 /100 | #250 | Tragic 11.8% |
| Blacks/African Americans | 1.6 /100 | #251 | Tragic 11.9% |
| Immigrants | Serbia | 1.5 /100 | #252 | Tragic 11.9% |
| Egyptians | 1.4 /100 | #253 | Tragic 11.9% |
| Immigrants | Uruguay | 1.3 /100 | #254 | Tragic 11.9% |
| Hondurans | 1.2 /100 | #255 | Tragic 12.0% |
| Liberians | 1.2 /100 | #256 | Tragic 12.0% |
| Nigerians | 0.9 /100 | #257 | Tragic 12.1% |
| South American Indians | 0.9 /100 | #258 | Tragic 12.1% |
| Immigrants | Latvia | 0.8 /100 | #259 | Tragic 12.1% |
| Macedonians | 0.7 /100 | #260 | Tragic 12.2% |
| Sub-Saharan Africans | 0.6 /100 | #261 | Tragic 12.2% |
| Immigrants | Liberia | 0.6 /100 | #262 | Tragic 12.2% |
Demographics Similar to Immigrants from Bahamas by No Vehicles in Household
In terms of no vehicles in household, the demographic groups most similar to Immigrants from Bahamas are Chilean (9.9%, a difference of 0.0%), Bahamian (9.9%, a difference of 0.030%), Hungarian (9.9%, a difference of 0.26%), Immigrants from Nicaragua (9.9%, a difference of 0.31%), and Immigrants from Zimbabwe (9.9%, a difference of 0.35%).
| Demographics | Rating | Rank | No Vehicles in Household |
| Immigrants | Moldova | 84.6 /100 | #137 | Excellent 9.8% |
| Estonians | 84.2 /100 | #138 | Excellent 9.8% |
| Marshallese | 84.0 /100 | #139 | Excellent 9.8% |
| Immigrants | Lithuania | 84.0 /100 | #140 | Excellent 9.8% |
| Sudanese | 83.1 /100 | #141 | Excellent 9.8% |
| Immigrants | Zimbabwe | 82.6 /100 | #142 | Excellent 9.9% |
| Chileans | 81.2 /100 | #143 | Excellent 9.9% |
| Immigrants | Bahamas | 81.2 /100 | #144 | Excellent 9.9% |
| Bahamians | 81.0 /100 | #145 | Excellent 9.9% |
| Hungarians | 80.0 /100 | #146 | Excellent 9.9% |
| Immigrants | Nicaragua | 79.8 /100 | #147 | Good 9.9% |
| Immigrants | Bosnia and Herzegovina | 79.1 /100 | #148 | Good 9.9% |
| Immigrants | Uganda | 76.1 /100 | #149 | Good 10.0% |
| Colombians | 73.9 /100 | #150 | Good 10.0% |
| Immigrants | Eastern Africa | 73.8 /100 | #151 | Good 10.0% |