Immigrants from Costa Rica vs Immigrants from Bahamas No Vehicles in Household
COMPARE
Immigrants from Costa Rica
Immigrants from Bahamas
No Vehicles in Household
No Vehicles in Household Comparison
Immigrants from Costa Rica
Immigrants from Bahamas
10.3%
NO VEHICLES IN HOUSEHOLD
60.5/ 100
METRIC RATING
166th/ 347
METRIC RANK
9.9%
NO VEHICLES IN HOUSEHOLD
81.2/ 100
METRIC RATING
144th/ 347
METRIC RANK
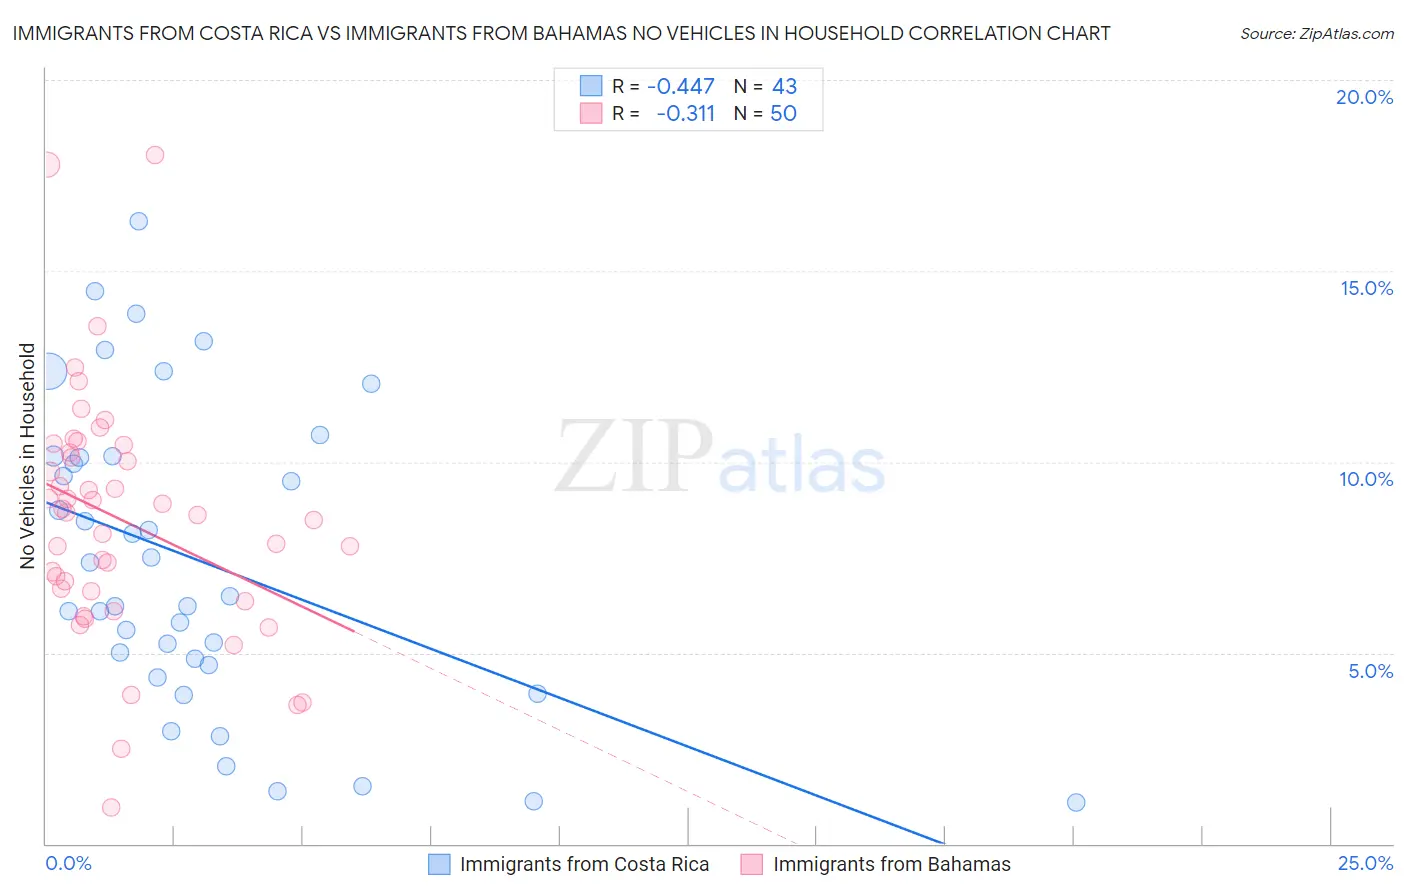
Immigrants from Costa Rica vs Immigrants from Bahamas No Vehicles in Household Correlation Chart
The statistical analysis conducted on geographies consisting of 204,170,625 people shows a moderate negative correlation between the proportion of Immigrants from Costa Rica and percentage of households with no vehicle available in the United States with a correlation coefficient (R) of -0.447 and weighted average of 10.3%. Similarly, the statistical analysis conducted on geographies consisting of 104,565,234 people shows a mild negative correlation between the proportion of Immigrants from Bahamas and percentage of households with no vehicle available in the United States with a correlation coefficient (R) of -0.311 and weighted average of 9.9%, a difference of 3.7%.
No Vehicles in Household Correlation Summary
| Measurement | Immigrants from Costa Rica | Immigrants from Bahamas |
| Minimum | 1.1% | 0.94% |
| Maximum | 16.3% | 18.0% |
| Range | 15.2% | 17.1% |
| Mean | 7.4% | 8.5% |
| Median | 6.5% | 8.6% |
| Interquartile 25% (IQ1) | 4.7% | 6.6% |
| Interquartile 75% (IQ3) | 10.1% | 10.2% |
| Interquartile Range (IQR) | 5.5% | 3.6% |
| Standard Deviation (Sample) | 3.9% | 3.2% |
| Standard Deviation (Population) | 3.9% | 3.2% |
Similar Demographics by No Vehicles in Household
Demographics Similar to Immigrants from Costa Rica by No Vehicles in Household
In terms of no vehicles in household, the demographic groups most similar to Immigrants from Costa Rica are Comanche (10.2%, a difference of 0.050%), South African (10.2%, a difference of 0.10%), Immigrants from Saudi Arabia (10.3%, a difference of 0.24%), Immigrants from Cambodia (10.2%, a difference of 0.47%), and Indonesian (10.3%, a difference of 0.54%).
| Demographics | Rating | Rank | No Vehicles in Household |
| Immigrants | Indonesia | 69.3 /100 | #159 | Good 10.1% |
| Immigrants | Middle Africa | 65.7 /100 | #160 | Good 10.2% |
| New Zealanders | 65.1 /100 | #161 | Good 10.2% |
| Immigrants | Austria | 64.4 /100 | #162 | Good 10.2% |
| Immigrants | Cambodia | 63.7 /100 | #163 | Good 10.2% |
| South Africans | 61.1 /100 | #164 | Good 10.2% |
| Comanche | 60.8 /100 | #165 | Good 10.2% |
| Immigrants | Costa Rica | 60.5 /100 | #166 | Good 10.3% |
| Immigrants | Saudi Arabia | 58.8 /100 | #167 | Average 10.3% |
| Indonesians | 56.7 /100 | #168 | Average 10.3% |
| Lumbee | 54.7 /100 | #169 | Average 10.3% |
| Immigrants | Latin America | 53.2 /100 | #170 | Average 10.4% |
| Hmong | 52.7 /100 | #171 | Average 10.4% |
| Brazilians | 51.7 /100 | #172 | Average 10.4% |
| Filipinos | 50.1 /100 | #173 | Average 10.4% |
Demographics Similar to Immigrants from Bahamas by No Vehicles in Household
In terms of no vehicles in household, the demographic groups most similar to Immigrants from Bahamas are Chilean (9.9%, a difference of 0.0%), Bahamian (9.9%, a difference of 0.030%), Hungarian (9.9%, a difference of 0.26%), Immigrants from Nicaragua (9.9%, a difference of 0.31%), and Immigrants from Zimbabwe (9.9%, a difference of 0.35%).
| Demographics | Rating | Rank | No Vehicles in Household |
| Immigrants | Moldova | 84.6 /100 | #137 | Excellent 9.8% |
| Estonians | 84.2 /100 | #138 | Excellent 9.8% |
| Marshallese | 84.0 /100 | #139 | Excellent 9.8% |
| Immigrants | Lithuania | 84.0 /100 | #140 | Excellent 9.8% |
| Sudanese | 83.1 /100 | #141 | Excellent 9.8% |
| Immigrants | Zimbabwe | 82.6 /100 | #142 | Excellent 9.9% |
| Chileans | 81.2 /100 | #143 | Excellent 9.9% |
| Immigrants | Bahamas | 81.2 /100 | #144 | Excellent 9.9% |
| Bahamians | 81.0 /100 | #145 | Excellent 9.9% |
| Hungarians | 80.0 /100 | #146 | Excellent 9.9% |
| Immigrants | Nicaragua | 79.8 /100 | #147 | Good 9.9% |
| Immigrants | Bosnia and Herzegovina | 79.1 /100 | #148 | Good 9.9% |
| Immigrants | Uganda | 76.1 /100 | #149 | Good 10.0% |
| Colombians | 73.9 /100 | #150 | Good 10.0% |
| Immigrants | Eastern Africa | 73.8 /100 | #151 | Good 10.0% |