Moroccan vs Immigrants from Bahamas No Vehicles in Household

COMPARE

Moroccan
Race
Ancestry
AfghanAfricanAlaska NativeAlaskan AthabascanAlbanianAleutAlsatianAmericanApacheArabArapahoArgentineanArmenianAssyrian/Chaldean/SyriacAustralianAustrianBahamianBangladeshiBarbadianBasqueBelgianBelizeanBermudanBhutaneseBlackfeetBolivianBrazilianBritishBritish West IndianBulgarianBurmeseCajunCambodianCanadianCape VerdeanCarpatho RusynCelticCentral AmericanCentral American IndianCherokeeCheyenneChickasawChileanChineseChippewaChoctawColombianColvilleComancheCosta RicanCreeCreekCroatianCrowCubanCypriotCzechCzechoslovakianDanishDelawareDominicanDutchDutch West IndianEastern EuropeanEcuadorianEgyptianEnglishEstonianEthiopianEuropeanFijianFilipinoFinnishFrenchFrench American IndianFrench CanadianGermanGerman RussianGhanaianGreekGuamanian/ChamorroGuatemalanGuyaneseHaitianHmongHonduranHopiHoumaHungarianIcelanderIndian (Asian)IndonesianInupiatIranianIraqiIrishIroquoisIsraeliItalianJamaicanJapaneseJordanianKenyanKiowaKoreanLaotianLatvianLebaneseLiberianLithuanianLumbeeLuxembourgerMacedonianMalaysianMalteseMarshalleseMenomineeMexicanMexican American IndianMongolianMoroccanNative HawaiianNavajoNepaleseNew ZealanderNicaraguanNigerianNorthern EuropeanNorwegianOkinawanOsageOttawaPaiutePakistaniPalestinianPanamanianParaguayanPennsylvania GermanPeruvianPimaPolishPortuguesePotawatomiPuebloPuerto RicanPuget Sound SalishRomanianRussianSalvadoranSamoanScandinavianScotch-IrishScottishSeminoleSenegaleseSerbianShoshoneSierra LeoneanSiouxSlavicSlovakSloveneSomaliSouth AfricanSouth AmericanSouth American IndianSoviet UnionSpaniardSpanishSpanish AmericanSpanish American IndianSri LankanSubsaharan AfricanSudaneseSwedishSwissSyrianTaiwaneseThaiTlingit-HaidaTohono O'OdhamTonganTrinidadian and TobagonianTsimshianTurkishU.S. Virgin IslanderUgandanUkrainianUruguayanUteVenezuelanVietnameseWelshWest IndianYakamaYaquiYugoslavianYumanYup'ikZimbabwean
Immigration
NonimmigrantsImmigrantsAfghanistanAfricaAlbaniaArgentinaArmeniaAsiaAustraliaAustriaBangladeshBarbadosBelarusBelgiumBelizeBoliviaBosnia and HerzegovinaBrazilBulgariaBurma/MyanmarCabo VerdeCambodiaCameroonCanadaCaribbeanCentral AmericaChileChinaColombiaCongoCosta RicaCroatiaCubaCzechoslovakiaDenmarkDominicaDominican RepublicEastern AfricaEastern AsiaEastern EuropeEcuadorEgyptEl SalvadorEnglandEritreaEthiopiaEuropeFijiFranceGermanyGhanaGreeceGrenadaGuatemalaGuyanaHaitiHondurasHong KongHungaryIndiaIndonesiaIranIraqIrelandIsraelItalyJamaicaJapanJordanKazakhstanKenyaKoreaKuwaitLaosLatin AmericaLatviaLebanonLiberiaLithuaniaMalaysiaMexicoMicronesiaMiddle AfricaMoldovaMoroccoNepalNetherlandsNicaraguaNigeriaNorth AmericaNorth MacedoniaNorthern AfricaNorthern EuropeNorwayOceaniaPakistanPanamaPeruPhilippinesPolandPortugalRomaniaRussiaSaudi ArabiaScotlandSenegalSerbiaSierra LeoneSingaporeSomaliaSouth AfricaSouth AmericaSouth Central AsiaSouth Eastern AsiaSouthern EuropeSpainSri LankaSt. Vincent and the GrenadinesSudanSwedenSwitzerlandSyriaTaiwanThailandTrinidad and TobagoTurkeyUgandaUkraineUruguayUzbekistanVenezuelaVietnamWest IndiesWestern AfricaWestern AsiaWestern EuropeYemenZaireZimbabweAzores
Immigrants from Bahamas
Race
Ancestry
AfghanAfricanAlaska NativeAlaskan AthabascanAlbanianAleutAlsatianAmericanApacheArabArapahoArgentineanArmenianAssyrian/Chaldean/SyriacAustralianAustrianBahamianBangladeshiBarbadianBasqueBelgianBelizeanBermudanBhutaneseBlackfeetBolivianBrazilianBritishBritish West IndianBulgarianBurmeseCajunCambodianCanadianCape VerdeanCarpatho RusynCelticCentral AmericanCentral American IndianCherokeeCheyenneChickasawChileanChineseChippewaChoctawColombianColvilleComancheCosta RicanCreeCreekCroatianCrowCubanCypriotCzechCzechoslovakianDanishDelawareDominicanDutchDutch West IndianEastern EuropeanEcuadorianEgyptianEnglishEstonianEthiopianEuropeanFijianFilipinoFinnishFrenchFrench American IndianFrench CanadianGermanGerman RussianGhanaianGreekGuamanian/ChamorroGuatemalanGuyaneseHaitianHmongHonduranHopiHoumaHungarianIcelanderIndian (Asian)IndonesianInupiatIranianIraqiIrishIroquoisIsraeliItalianJamaicanJapaneseJordanianKenyanKiowaKoreanLaotianLatvianLebaneseLiberianLithuanianLumbeeLuxembourgerMacedonianMalaysianMalteseMarshalleseMenomineeMexicanMexican American IndianMongolianNative HawaiianNavajoNepaleseNew ZealanderNicaraguanNigerianNorthern EuropeanNorwegianOkinawanOsageOttawaPaiutePakistaniPalestinianPanamanianParaguayanPennsylvania GermanPeruvianPimaPolishPortuguesePotawatomiPuebloPuerto RicanPuget Sound SalishRomanianRussianSalvadoranSamoanScandinavianScotch-IrishScottishSeminoleSenegaleseSerbianShoshoneSierra LeoneanSiouxSlavicSlovakSloveneSomaliSouth AfricanSouth AmericanSouth American IndianSoviet UnionSpaniardSpanishSpanish AmericanSpanish American IndianSri LankanSubsaharan AfricanSudaneseSwedishSwissSyrianTaiwaneseThaiTlingit-HaidaTohono O'OdhamTonganTrinidadian and TobagonianTsimshianTurkishU.S. Virgin IslanderUgandanUkrainianUruguayanUteVenezuelanVietnameseWelshWest IndianYakamaYaquiYugoslavianYumanYup'ikZimbabwean
Immigration
NonimmigrantsImmigrantsAfghanistanAfricaAlbaniaArgentinaArmeniaAsiaAustraliaAustriaBahamasBangladeshBarbadosBelarusBelgiumBelizeBoliviaBosnia and HerzegovinaBrazilBulgariaBurma/MyanmarCabo VerdeCambodiaCameroonCanadaCaribbeanCentral AmericaChileChinaColombiaCongoCosta RicaCroatiaCubaCzechoslovakiaDenmarkDominicaDominican RepublicEastern AfricaEastern AsiaEastern EuropeEcuadorEgyptEl SalvadorEnglandEritreaEthiopiaEuropeFijiFranceGermanyGhanaGreeceGrenadaGuatemalaGuyanaHaitiHondurasHong KongHungaryIndiaIndonesiaIranIraqIrelandIsraelItalyJamaicaJapanJordanKazakhstanKenyaKoreaKuwaitLaosLatin AmericaLatviaLebanonLiberiaLithuaniaMalaysiaMexicoMicronesiaMiddle AfricaMoldovaMoroccoNepalNetherlandsNicaraguaNigeriaNorth AmericaNorth MacedoniaNorthern AfricaNorthern EuropeNorwayOceaniaPakistanPanamaPeruPhilippinesPolandPortugalRomaniaRussiaSaudi ArabiaScotlandSenegalSerbiaSierra LeoneSingaporeSomaliaSouth AfricaSouth AmericaSouth Central AsiaSouth Eastern AsiaSouthern EuropeSpainSri LankaSt. Vincent and the GrenadinesSudanSwedenSwitzerlandSyriaTaiwanThailandTrinidad and TobagoTurkeyUgandaUkraineUruguayUzbekistanVenezuelaVietnamWest IndiesWestern AfricaWestern AsiaWestern EuropeYemenZaireZimbabweAzores
No Vehicles in Household
Income
Poverty
Unemployment
Labor Participation
Family Structure
Vehicle Availability
Education Level
Disability

No Vehicles in Household Comparison

Moroccans

Immigrants from Bahamas

Tragic
Excellent
14.7%
NO VEHICLES IN HOUSEHOLD
0.0/ 100
METRIC RATING
298th/ 347
METRIC RANK
9.9%
NO VEHICLES IN HOUSEHOLD
81.2/ 100
METRIC RATING
144th/ 347
METRIC RANK

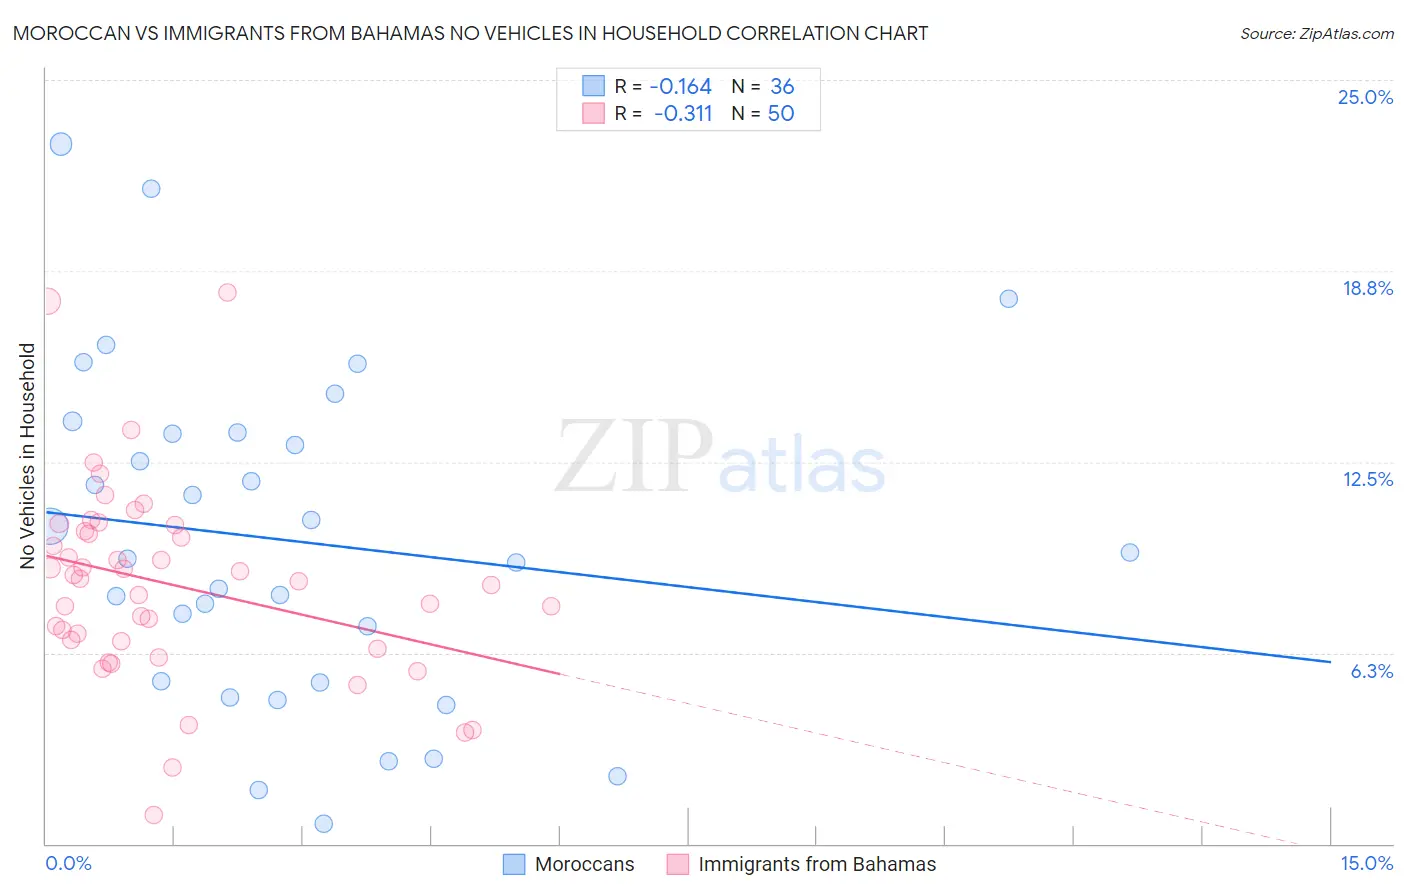
Moroccan vs Immigrants from Bahamas No Vehicles in Household Correlation Chart

The statistical analysis conducted on geographies consisting of 201,657,116 people shows a poor negative correlation between the proportion of Moroccans and percentage of households with no vehicle available in the United States with a correlation coefficient (R) of -0.164 and weighted average of 14.7%. Similarly, the statistical analysis conducted on geographies consisting of 104,565,234 people shows a mild negative correlation between the proportion of Immigrants from Bahamas and percentage of households with no vehicle available in the United States with a correlation coefficient (R) of -0.311 and weighted average of 9.9%, a difference of 48.3%.
Moroccan vs Immigrants from Bahamas No Vehicles in Household

No Vehicles in Household Correlation Summary

MeasurementMoroccanImmigrants from Bahamas
Minimum0.64%0.94%
Maximum22.9%18.0%
Range22.3%17.1%
Mean9.9%8.5%
Median9.4%8.6%
Interquartile 25% (IQ1)5.3%6.6%
Interquartile 75% (IQ3)13.4%10.2%
Interquartile Range (IQR)8.2%3.6%
Standard Deviation (Sample)5.4%3.2%
Standard Deviation (Population)5.4%3.2%

Similar Demographics by No Vehicles in Household

Demographics Similar to Moroccans by No Vehicles in Household

In terms of no vehicles in household, the demographic groups most similar to Moroccans are Immigrants from Panama (14.6%, a difference of 0.15%), Immigrants from Greece (14.7%, a difference of 0.20%), Immigrants from Spain (14.5%, a difference of 0.82%), Yuman (14.9%, a difference of 1.3%), and Immigrants from Ukraine (14.9%, a difference of 1.3%).
DemographicsRating | RankNo Vehicles in Household
Okinawans
0.0
/100
|
#291
Tragic
14.1%
Pima
0.0
/100
|
#292
Tragic
14.1%
Immigrants | Jamaica
0.0
/100
|
#293
Tragic
14.2%
Belizeans
0.0
/100
|
#294
Tragic
14.3%
Paraguayans
0.0
/100
|
#295
Tragic
14.4%
Immigrants | Spain
0.0
/100
|
#296
Tragic
14.5%
Immigrants | Panama
0.0
/100
|
#297
Tragic
14.6%
Moroccans
0.0
/100
|
#298
Tragic
14.7%
Immigrants | Greece
0.0
/100
|
#299
Tragic
14.7%
Yuman
0.0
/100
|
#300
Tragic
14.9%
Immigrants | Ukraine
0.0
/100
|
#301
Tragic
14.9%
Haitians
0.0
/100
|
#302
Tragic
14.9%
Immigrants | Western Africa
0.0
/100
|
#303
Tragic
15.0%
Immigrants | Russia
0.0
/100
|
#304
Tragic
15.1%
Immigrants | China
0.0
/100
|
#305
Tragic
15.2%

Demographics Similar to Immigrants from Bahamas by No Vehicles in Household

In terms of no vehicles in household, the demographic groups most similar to Immigrants from Bahamas are Chilean (9.9%, a difference of 0.0%), Bahamian (9.9%, a difference of 0.030%), Hungarian (9.9%, a difference of 0.26%), Immigrants from Nicaragua (9.9%, a difference of 0.31%), and Immigrants from Zimbabwe (9.9%, a difference of 0.35%).
DemographicsRating | RankNo Vehicles in Household
Immigrants | Moldova
84.6
/100
|
#137
Excellent
9.8%
Estonians
84.2
/100
|
#138
Excellent
9.8%
Marshallese
84.0
/100
|
#139
Excellent
9.8%
Immigrants | Lithuania
84.0
/100
|
#140
Excellent
9.8%
Sudanese
83.1
/100
|
#141
Excellent
9.8%
Immigrants | Zimbabwe
82.6
/100
|
#142
Excellent
9.9%
Chileans
81.2
/100
|
#143
Excellent
9.9%
Immigrants | Bahamas
81.2
/100
|
#144
Excellent
9.9%
Bahamians
81.0
/100
|
#145
Excellent
9.9%
Hungarians
80.0
/100
|
#146
Excellent
9.9%
Immigrants | Nicaragua
79.8
/100
|
#147
Good
9.9%
Immigrants | Bosnia and Herzegovina
79.1
/100
|
#148
Good
9.9%
Immigrants | Uganda
76.1
/100
|
#149
Good
10.0%
Colombians
73.9
/100
|
#150
Good
10.0%
Immigrants | Eastern Africa
73.8
/100
|
#151
Good
10.0%