Ethiopian vs Immigrants from Uruguay 4 or more Vehicles in Household
COMPARE
Ethiopian
Immigrants from Uruguay
4 or more Vehicles in Household
4 or more Vehicles in Household Comparison
Ethiopians
Immigrants from Uruguay
5.8%
4 OR MORE VEHICLES IN HOUSEHOLD
3.2/ 100
METRIC RATING
244th/ 347
METRIC RANK
5.4%
4 OR MORE VEHICLES IN HOUSEHOLD
0.3/ 100
METRIC RATING
279th/ 347
METRIC RANK
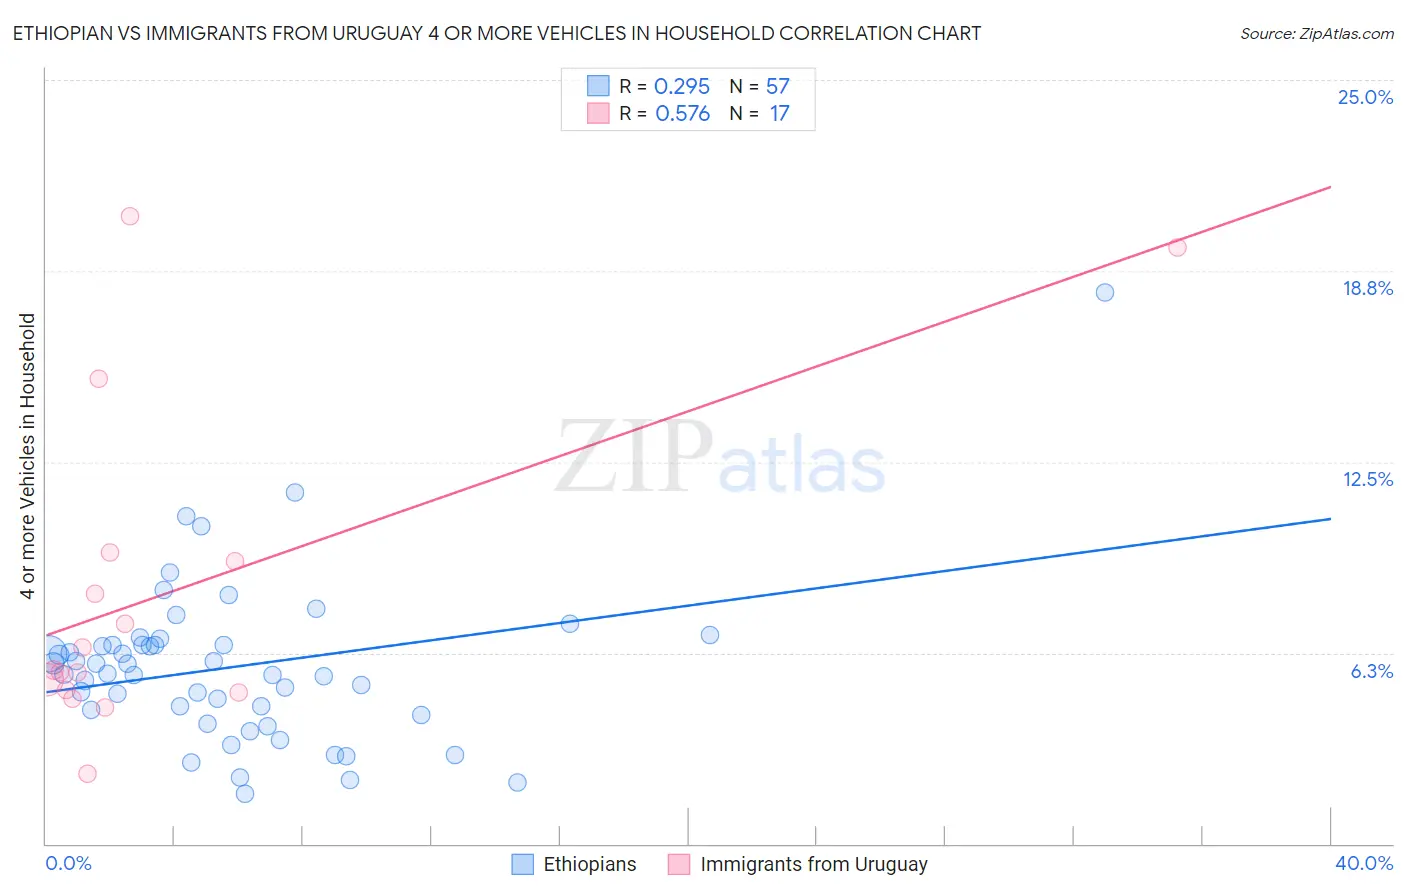
Ethiopian vs Immigrants from Uruguay 4 or more Vehicles in Household Correlation Chart
The statistical analysis conducted on geographies consisting of 222,112,798 people shows a weak positive correlation between the proportion of Ethiopians and percentage of households with 4 or more vehicles available in the United States with a correlation coefficient (R) of 0.295 and weighted average of 5.8%. Similarly, the statistical analysis conducted on geographies consisting of 132,880,755 people shows a substantial positive correlation between the proportion of Immigrants from Uruguay and percentage of households with 4 or more vehicles available in the United States with a correlation coefficient (R) of 0.576 and weighted average of 5.4%, a difference of 6.8%.
4 or more Vehicles in Household Correlation Summary
| Measurement | Ethiopian | Immigrants from Uruguay |
| Minimum | 1.6% | 2.3% |
| Maximum | 18.0% | 20.5% |
| Range | 16.4% | 18.2% |
| Mean | 5.8% | 8.2% |
| Median | 5.6% | 5.7% |
| Interquartile 25% (IQ1) | 4.3% | 5.0% |
| Interquartile 75% (IQ3) | 6.5% | 9.4% |
| Interquartile Range (IQR) | 2.2% | 4.4% |
| Standard Deviation (Sample) | 2.7% | 5.3% |
| Standard Deviation (Population) | 2.6% | 5.1% |
Similar Demographics by 4 or more Vehicles in Household
Demographics Similar to Ethiopians by 4 or more Vehicles in Household
In terms of 4 or more vehicles in household, the demographic groups most similar to Ethiopians are Immigrants from Czechoslovakia (5.8%, a difference of 0.010%), Bulgarian (5.8%, a difference of 0.040%), Immigrants from Middle Africa (5.8%, a difference of 0.20%), Mongolian (5.8%, a difference of 0.41%), and Immigrants from Poland (5.8%, a difference of 0.50%).
| Demographics | Rating | Rank | 4 or more Vehicles in Household |
| Turks | 4.1 /100 | #237 | Tragic 5.8% |
| Immigrants | Belgium | 4.0 /100 | #238 | Tragic 5.8% |
| Immigrants | Australia | 3.8 /100 | #239 | Tragic 5.8% |
| Immigrants | Poland | 3.8 /100 | #240 | Tragic 5.8% |
| Mongolians | 3.7 /100 | #241 | Tragic 5.8% |
| Immigrants | Middle Africa | 3.4 /100 | #242 | Tragic 5.8% |
| Immigrants | Czechoslovakia | 3.2 /100 | #243 | Tragic 5.8% |
| Ethiopians | 3.2 /100 | #244 | Tragic 5.8% |
| Bulgarians | 3.1 /100 | #245 | Tragic 5.8% |
| Immigrants | North Macedonia | 2.5 /100 | #246 | Tragic 5.7% |
| Immigrants | Ethiopia | 2.4 /100 | #247 | Tragic 5.7% |
| Immigrants | Eastern Africa | 2.4 /100 | #248 | Tragic 5.7% |
| Immigrants | Southern Europe | 2.3 /100 | #249 | Tragic 5.7% |
| Immigrants | Europe | 2.3 /100 | #250 | Tragic 5.7% |
| Ugandans | 2.2 /100 | #251 | Tragic 5.7% |
Demographics Similar to Immigrants from Uruguay by 4 or more Vehicles in Household
In terms of 4 or more vehicles in household, the demographic groups most similar to Immigrants from Uruguay are Alsatian (5.4%, a difference of 0.010%), Immigrants from Western Africa (5.4%, a difference of 0.080%), Immigrants from Spain (5.4%, a difference of 0.25%), Immigrants from Ireland (5.4%, a difference of 0.33%), and Immigrants from Eastern Europe (5.4%, a difference of 0.46%).
| Demographics | Rating | Rank | 4 or more Vehicles in Household |
| Immigrants | Kazakhstan | 0.6 /100 | #272 | Tragic 5.5% |
| Macedonians | 0.6 /100 | #273 | Tragic 5.5% |
| Blacks/African Americans | 0.6 /100 | #274 | Tragic 5.5% |
| Cambodians | 0.5 /100 | #275 | Tragic 5.5% |
| Immigrants | Latvia | 0.5 /100 | #276 | Tragic 5.5% |
| Immigrants | Bulgaria | 0.5 /100 | #277 | Tragic 5.5% |
| Immigrants | Eastern Europe | 0.4 /100 | #278 | Tragic 5.4% |
| Immigrants | Uruguay | 0.3 /100 | #279 | Tragic 5.4% |
| Alsatians | 0.3 /100 | #280 | Tragic 5.4% |
| Immigrants | Western Africa | 0.3 /100 | #281 | Tragic 5.4% |
| Immigrants | Spain | 0.3 /100 | #282 | Tragic 5.4% |
| Immigrants | Ireland | 0.3 /100 | #283 | Tragic 5.4% |
| Brazilians | 0.3 /100 | #284 | Tragic 5.4% |
| Immigrants | Liberia | 0.2 /100 | #285 | Tragic 5.4% |
| Immigrants | Colombia | 0.2 /100 | #286 | Tragic 5.4% |