Ethiopian vs Paraguayan 4 or more Vehicles in Household
COMPARE
Ethiopian
Paraguayan
4 or more Vehicles in Household
4 or more Vehicles in Household Comparison
Ethiopians
Paraguayans
5.8%
4 OR MORE VEHICLES IN HOUSEHOLD
3.2/ 100
METRIC RATING
244th/ 347
METRIC RANK
4.9%
4 OR MORE VEHICLES IN HOUSEHOLD
0.0/ 100
METRIC RATING
308th/ 347
METRIC RANK
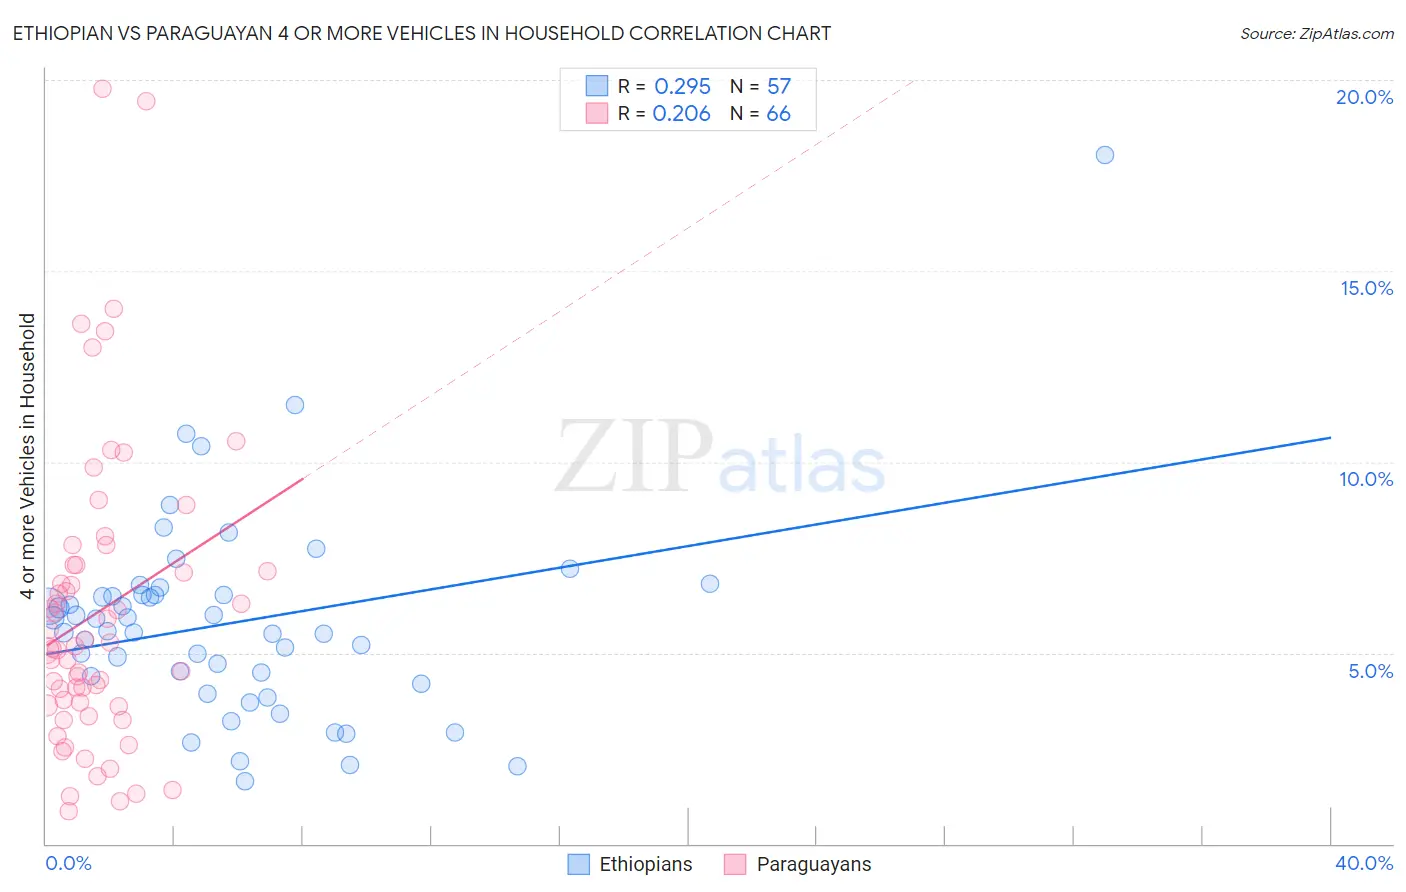
Ethiopian vs Paraguayan 4 or more Vehicles in Household Correlation Chart
The statistical analysis conducted on geographies consisting of 222,112,798 people shows a weak positive correlation between the proportion of Ethiopians and percentage of households with 4 or more vehicles available in the United States with a correlation coefficient (R) of 0.295 and weighted average of 5.8%. Similarly, the statistical analysis conducted on geographies consisting of 94,888,057 people shows a weak positive correlation between the proportion of Paraguayans and percentage of households with 4 or more vehicles available in the United States with a correlation coefficient (R) of 0.206 and weighted average of 4.9%, a difference of 17.0%.
4 or more Vehicles in Household Correlation Summary
| Measurement | Ethiopian | Paraguayan |
| Minimum | 1.6% | 0.86% |
| Maximum | 18.0% | 19.8% |
| Range | 16.4% | 18.9% |
| Mean | 5.8% | 6.1% |
| Median | 5.6% | 5.1% |
| Interquartile 25% (IQ1) | 4.3% | 3.6% |
| Interquartile 75% (IQ3) | 6.5% | 7.3% |
| Interquartile Range (IQR) | 2.2% | 3.7% |
| Standard Deviation (Sample) | 2.7% | 3.9% |
| Standard Deviation (Population) | 2.6% | 3.9% |
Similar Demographics by 4 or more Vehicles in Household
Demographics Similar to Ethiopians by 4 or more Vehicles in Household
In terms of 4 or more vehicles in household, the demographic groups most similar to Ethiopians are Immigrants from Czechoslovakia (5.8%, a difference of 0.010%), Bulgarian (5.8%, a difference of 0.040%), Immigrants from Middle Africa (5.8%, a difference of 0.20%), Mongolian (5.8%, a difference of 0.41%), and Immigrants from Poland (5.8%, a difference of 0.50%).
| Demographics | Rating | Rank | 4 or more Vehicles in Household |
| Turks | 4.1 /100 | #237 | Tragic 5.8% |
| Immigrants | Belgium | 4.0 /100 | #238 | Tragic 5.8% |
| Immigrants | Australia | 3.8 /100 | #239 | Tragic 5.8% |
| Immigrants | Poland | 3.8 /100 | #240 | Tragic 5.8% |
| Mongolians | 3.7 /100 | #241 | Tragic 5.8% |
| Immigrants | Middle Africa | 3.4 /100 | #242 | Tragic 5.8% |
| Immigrants | Czechoslovakia | 3.2 /100 | #243 | Tragic 5.8% |
| Ethiopians | 3.2 /100 | #244 | Tragic 5.8% |
| Bulgarians | 3.1 /100 | #245 | Tragic 5.8% |
| Immigrants | North Macedonia | 2.5 /100 | #246 | Tragic 5.7% |
| Immigrants | Ethiopia | 2.4 /100 | #247 | Tragic 5.7% |
| Immigrants | Eastern Africa | 2.4 /100 | #248 | Tragic 5.7% |
| Immigrants | Southern Europe | 2.3 /100 | #249 | Tragic 5.7% |
| Immigrants | Europe | 2.3 /100 | #250 | Tragic 5.7% |
| Ugandans | 2.2 /100 | #251 | Tragic 5.7% |
Demographics Similar to Paraguayans by 4 or more Vehicles in Household
In terms of 4 or more vehicles in household, the demographic groups most similar to Paraguayans are Immigrants from Somalia (4.9%, a difference of 0.15%), Moroccan (4.9%, a difference of 0.54%), Houma (4.9%, a difference of 0.54%), Menominee (5.0%, a difference of 0.72%), and Immigrants from Serbia (5.0%, a difference of 1.7%).
| Demographics | Rating | Rank | 4 or more Vehicles in Household |
| Immigrants | Zaire | 0.0 /100 | #301 | Tragic 5.1% |
| Bahamians | 0.0 /100 | #302 | Tragic 5.1% |
| Immigrants | Greece | 0.0 /100 | #303 | Tragic 5.1% |
| Cypriots | 0.0 /100 | #304 | Tragic 5.0% |
| Somalis | 0.0 /100 | #305 | Tragic 5.0% |
| Immigrants | Serbia | 0.0 /100 | #306 | Tragic 5.0% |
| Menominee | 0.0 /100 | #307 | Tragic 5.0% |
| Paraguayans | 0.0 /100 | #308 | Tragic 4.9% |
| Immigrants | Somalia | 0.0 /100 | #309 | Tragic 4.9% |
| Moroccans | 0.0 /100 | #310 | Tragic 4.9% |
| Houma | 0.0 /100 | #311 | Tragic 4.9% |
| Albanians | 0.0 /100 | #312 | Tragic 4.8% |
| Immigrants | Israel | 0.0 /100 | #313 | Tragic 4.8% |
| Immigrants | West Indies | 0.0 /100 | #314 | Tragic 4.7% |
| Immigrants | Belarus | 0.0 /100 | #315 | Tragic 4.7% |