Ethiopian vs Immigrants from Philippines 4 or more Vehicles in Household
COMPARE
Ethiopian
Immigrants from Philippines
4 or more Vehicles in Household
4 or more Vehicles in Household Comparison
Ethiopians
Immigrants from Philippines
5.8%
4 OR MORE VEHICLES IN HOUSEHOLD
3.2/ 100
METRIC RATING
244th/ 347
METRIC RANK
8.5%
4 OR MORE VEHICLES IN HOUSEHOLD
100.0/ 100
METRIC RATING
23rd/ 347
METRIC RANK
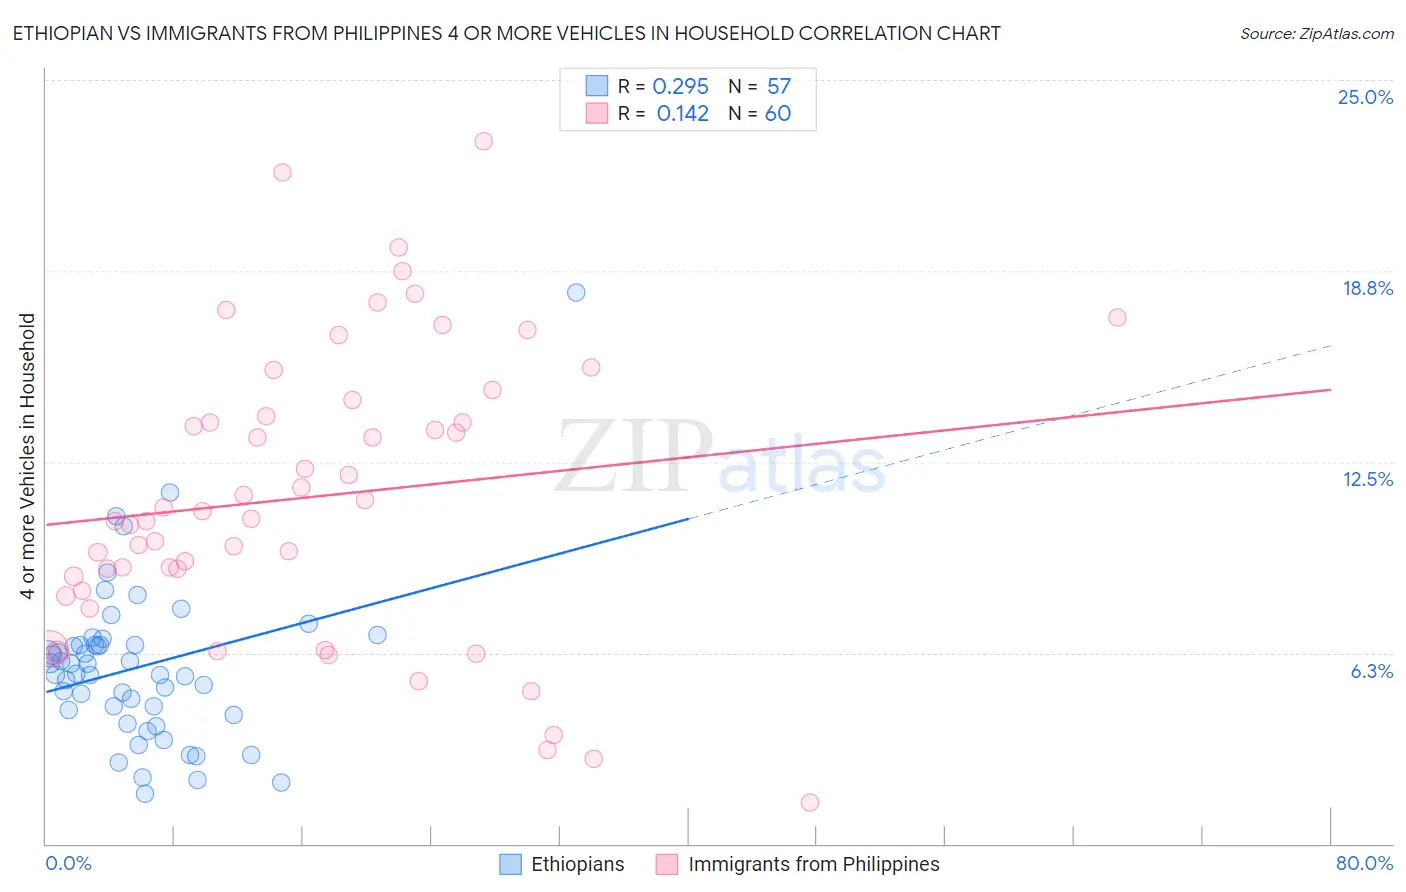
Ethiopian vs Immigrants from Philippines 4 or more Vehicles in Household Correlation Chart
The statistical analysis conducted on geographies consisting of 222,112,798 people shows a weak positive correlation between the proportion of Ethiopians and percentage of households with 4 or more vehicles available in the United States with a correlation coefficient (R) of 0.295 and weighted average of 5.8%. Similarly, the statistical analysis conducted on geographies consisting of 469,114,664 people shows a poor positive correlation between the proportion of Immigrants from Philippines and percentage of households with 4 or more vehicles available in the United States with a correlation coefficient (R) of 0.142 and weighted average of 8.5%, a difference of 48.0%.
4 or more Vehicles in Household Correlation Summary
| Measurement | Ethiopian | Immigrants from Philippines |
| Minimum | 1.6% | 1.4% |
| Maximum | 18.0% | 23.0% |
| Range | 16.4% | 21.6% |
| Mean | 5.8% | 11.4% |
| Median | 5.6% | 10.8% |
| Interquartile 25% (IQ1) | 4.3% | 8.5% |
| Interquartile 75% (IQ3) | 6.5% | 14.3% |
| Interquartile Range (IQR) | 2.2% | 5.7% |
| Standard Deviation (Sample) | 2.7% | 4.7% |
| Standard Deviation (Population) | 2.6% | 4.7% |
Similar Demographics by 4 or more Vehicles in Household
Demographics Similar to Ethiopians by 4 or more Vehicles in Household
In terms of 4 or more vehicles in household, the demographic groups most similar to Ethiopians are Immigrants from Czechoslovakia (5.8%, a difference of 0.010%), Bulgarian (5.8%, a difference of 0.040%), Immigrants from Middle Africa (5.8%, a difference of 0.20%), Mongolian (5.8%, a difference of 0.41%), and Immigrants from Poland (5.8%, a difference of 0.50%).
| Demographics | Rating | Rank | 4 or more Vehicles in Household |
| Turks | 4.1 /100 | #237 | Tragic 5.8% |
| Immigrants | Belgium | 4.0 /100 | #238 | Tragic 5.8% |
| Immigrants | Australia | 3.8 /100 | #239 | Tragic 5.8% |
| Immigrants | Poland | 3.8 /100 | #240 | Tragic 5.8% |
| Mongolians | 3.7 /100 | #241 | Tragic 5.8% |
| Immigrants | Middle Africa | 3.4 /100 | #242 | Tragic 5.8% |
| Immigrants | Czechoslovakia | 3.2 /100 | #243 | Tragic 5.8% |
| Ethiopians | 3.2 /100 | #244 | Tragic 5.8% |
| Bulgarians | 3.1 /100 | #245 | Tragic 5.8% |
| Immigrants | North Macedonia | 2.5 /100 | #246 | Tragic 5.7% |
| Immigrants | Ethiopia | 2.4 /100 | #247 | Tragic 5.7% |
| Immigrants | Eastern Africa | 2.4 /100 | #248 | Tragic 5.7% |
| Immigrants | Southern Europe | 2.3 /100 | #249 | Tragic 5.7% |
| Immigrants | Europe | 2.3 /100 | #250 | Tragic 5.7% |
| Ugandans | 2.2 /100 | #251 | Tragic 5.7% |
Demographics Similar to Immigrants from Philippines by 4 or more Vehicles in Household
In terms of 4 or more vehicles in household, the demographic groups most similar to Immigrants from Philippines are Immigrants from Vietnam (8.6%, a difference of 0.21%), Danish (8.6%, a difference of 0.26%), Pueblo (8.6%, a difference of 0.31%), Immigrants from Central America (8.5%, a difference of 0.82%), and Korean (8.6%, a difference of 1.1%).
| Demographics | Rating | Rank | 4 or more Vehicles in Household |
| Lumbee | 100.0 /100 | #16 | Exceptional 8.8% |
| Ute | 100.0 /100 | #17 | Exceptional 8.8% |
| Nepalese | 100.0 /100 | #18 | Exceptional 8.7% |
| Koreans | 100.0 /100 | #19 | Exceptional 8.6% |
| Pueblo | 100.0 /100 | #20 | Exceptional 8.6% |
| Danes | 100.0 /100 | #21 | Exceptional 8.6% |
| Immigrants | Vietnam | 100.0 /100 | #22 | Exceptional 8.6% |
| Immigrants | Philippines | 100.0 /100 | #23 | Exceptional 8.5% |
| Immigrants | Central America | 100.0 /100 | #24 | Exceptional 8.5% |
| Basques | 100.0 /100 | #25 | Exceptional 8.4% |
| Mexican American Indians | 100.0 /100 | #26 | Exceptional 8.4% |
| Sri Lankans | 100.0 /100 | #27 | Exceptional 8.4% |
| Cheyenne | 100.0 /100 | #28 | Exceptional 8.3% |
| Immigrants | South Eastern Asia | 100.0 /100 | #29 | Exceptional 8.2% |
| Navajo | 100.0 /100 | #30 | Exceptional 8.2% |