Ethiopian vs Immigrants from Uruguay Median Family Income
COMPARE
Ethiopian
Immigrants from Uruguay
Median Family Income
Median Family Income Comparison
Ethiopians
Immigrants from Uruguay
$108,251
MEDIAN FAMILY INCOME
94.5/ 100
METRIC RATING
118th/ 347
METRIC RANK
$98,205
MEDIAN FAMILY INCOME
9.2/ 100
METRIC RATING
208th/ 347
METRIC RANK
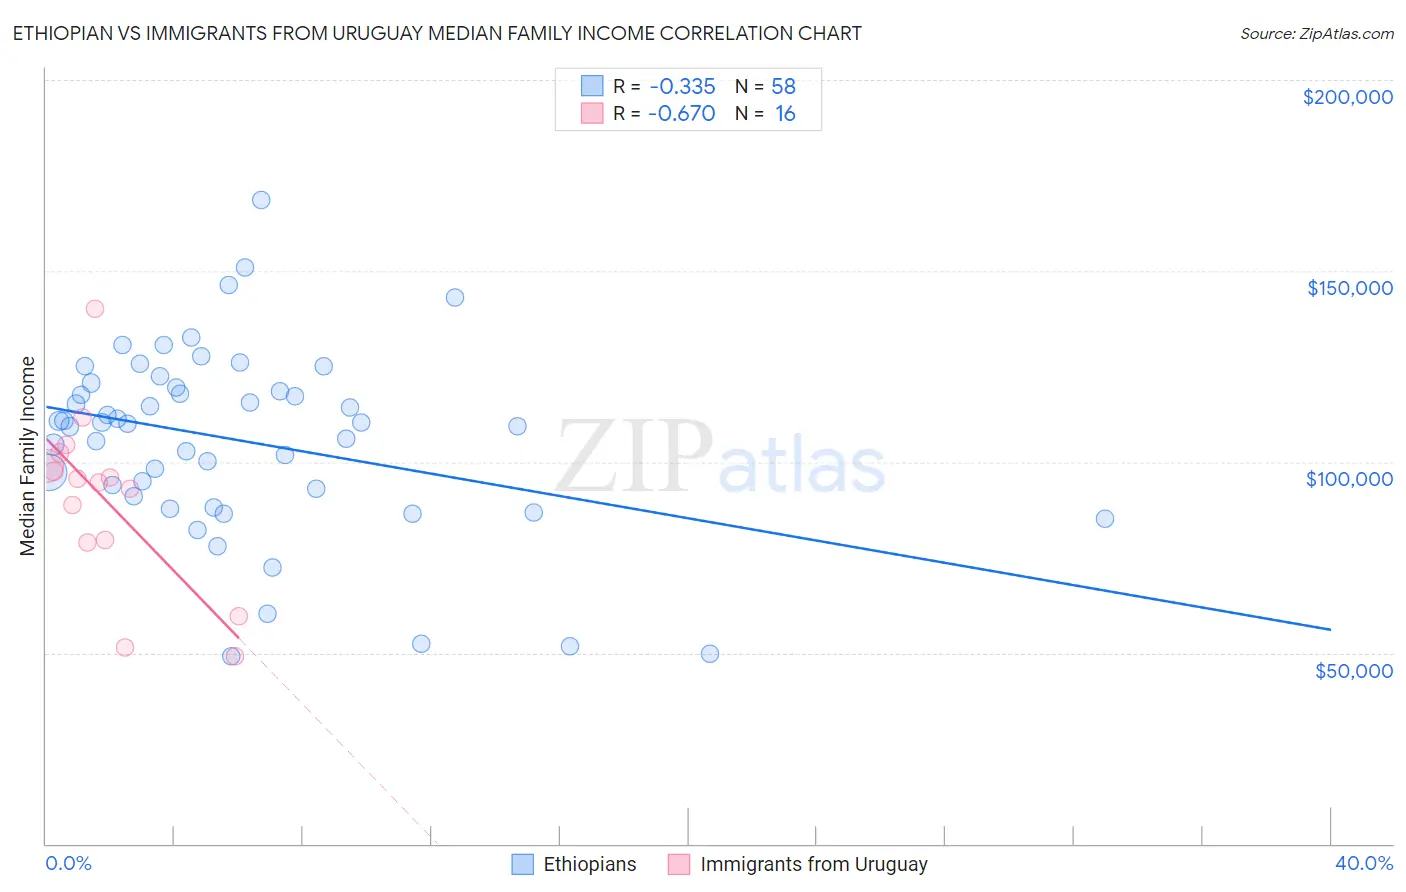
Ethiopian vs Immigrants from Uruguay Median Family Income Correlation Chart
The statistical analysis conducted on geographies consisting of 223,032,575 people shows a mild negative correlation between the proportion of Ethiopians and median family income in the United States with a correlation coefficient (R) of -0.335 and weighted average of $108,251. Similarly, the statistical analysis conducted on geographies consisting of 133,244,863 people shows a significant negative correlation between the proportion of Immigrants from Uruguay and median family income in the United States with a correlation coefficient (R) of -0.670 and weighted average of $98,205, a difference of 10.2%.
Median Family Income Correlation Summary
| Measurement | Ethiopian | Immigrants from Uruguay |
| Minimum | $48,964 | $49,007 |
| Maximum | $168,594 | $139,969 |
| Range | $119,630 | $90,962 |
| Mean | $105,611 | $90,062 |
| Median | $110,185 | $95,116 |
| Interquartile 25% (IQ1) | $91,124 | $79,263 |
| Interquartile 75% (IQ3) | $119,625 | $100,653 |
| Interquartile Range (IQR) | $28,501 | $21,390 |
| Standard Deviation (Sample) | $24,590 | $22,948 |
| Standard Deviation (Population) | $24,377 | $22,219 |
Similar Demographics by Median Family Income
Demographics Similar to Ethiopians by Median Family Income
In terms of median family income, the demographic groups most similar to Ethiopians are Sri Lankan ($108,234, a difference of 0.020%), Immigrants from Philippines ($108,288, a difference of 0.030%), Immigrants from Northern Africa ($108,161, a difference of 0.080%), European ($108,099, a difference of 0.14%), and Chilean ($108,429, a difference of 0.16%).
| Demographics | Rating | Rank | Median Family Income |
| Immigrants | Western Asia | 95.6 /100 | #111 | Exceptional $108,691 |
| Immigrants | Poland | 95.3 /100 | #112 | Exceptional $108,570 |
| Immigrants | Saudi Arabia | 95.2 /100 | #113 | Exceptional $108,544 |
| Poles | 95.2 /100 | #114 | Exceptional $108,507 |
| Swedes | 95.1 /100 | #115 | Exceptional $108,499 |
| Chileans | 95.0 /100 | #116 | Exceptional $108,429 |
| Immigrants | Philippines | 94.6 /100 | #117 | Exceptional $108,288 |
| Ethiopians | 94.5 /100 | #118 | Exceptional $108,251 |
| Sri Lankans | 94.5 /100 | #119 | Exceptional $108,234 |
| Immigrants | Northern Africa | 94.3 /100 | #120 | Exceptional $108,161 |
| Europeans | 94.1 /100 | #121 | Exceptional $108,099 |
| Immigrants | Jordan | 92.9 /100 | #122 | Exceptional $107,715 |
| Carpatho Rusyns | 92.2 /100 | #123 | Exceptional $107,502 |
| Pakistanis | 91.7 /100 | #124 | Exceptional $107,390 |
| Taiwanese | 91.4 /100 | #125 | Exceptional $107,295 |
Demographics Similar to Immigrants from Uruguay by Median Family Income
In terms of median family income, the demographic groups most similar to Immigrants from Uruguay are Immigrants from Colombia ($98,067, a difference of 0.14%), Puget Sound Salish ($97,958, a difference of 0.25%), Immigrants from Sudan ($97,737, a difference of 0.48%), Aleut ($98,702, a difference of 0.51%), and Panamanian ($97,683, a difference of 0.53%).
| Demographics | Rating | Rank | Median Family Income |
| Immigrants | Thailand | 19.0 /100 | #201 | Poor $99,840 |
| Whites/Caucasians | 18.7 /100 | #202 | Poor $99,800 |
| Scotch-Irish | 17.1 /100 | #203 | Poor $99,591 |
| Ghanaians | 12.6 /100 | #204 | Poor $98,877 |
| Hawaiians | 12.5 /100 | #205 | Poor $98,869 |
| Immigrants | Iraq | 12.1 /100 | #206 | Poor $98,786 |
| Aleuts | 11.6 /100 | #207 | Poor $98,702 |
| Immigrants | Uruguay | 9.2 /100 | #208 | Tragic $98,205 |
| Immigrants | Colombia | 8.7 /100 | #209 | Tragic $98,067 |
| Puget Sound Salish | 8.2 /100 | #210 | Tragic $97,958 |
| Immigrants | Sudan | 7.4 /100 | #211 | Tragic $97,737 |
| Panamanians | 7.2 /100 | #212 | Tragic $97,683 |
| Immigrants | Armenia | 7.0 /100 | #213 | Tragic $97,605 |
| Bermudans | 6.9 /100 | #214 | Tragic $97,577 |
| Nigerians | 6.7 /100 | #215 | Tragic $97,522 |