Ethiopian vs Immigrants from Uruguay Child Poverty Under the Age of 16
COMPARE
Ethiopian
Immigrants from Uruguay
Child Poverty Under the Age of 16
Child Poverty Under the Age of 16 Comparison
Ethiopians
Immigrants from Uruguay
16.3%
CHILD POVERTY UNDER THE AGE OF 16
43.4/ 100
METRIC RATING
177th/ 347
METRIC RANK
16.8%
CHILD POVERTY UNDER THE AGE OF 16
23.1/ 100
METRIC RATING
194th/ 347
METRIC RANK
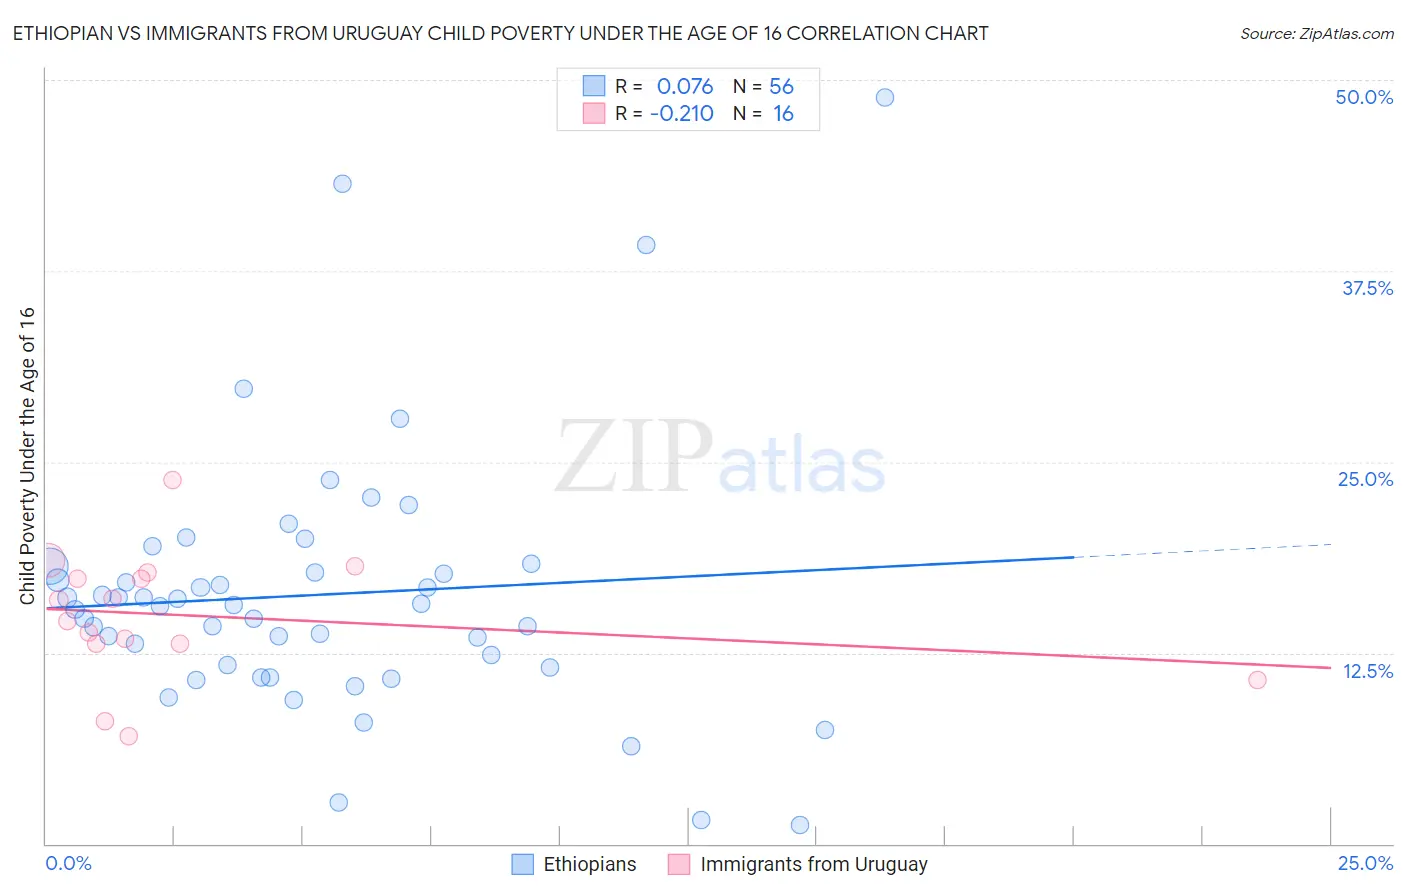
Ethiopian vs Immigrants from Uruguay Child Poverty Under the Age of 16 Correlation Chart
The statistical analysis conducted on geographies consisting of 222,374,928 people shows a slight positive correlation between the proportion of Ethiopians and poverty level among children under the age of 16 in the United States with a correlation coefficient (R) of 0.076 and weighted average of 16.3%. Similarly, the statistical analysis conducted on geographies consisting of 132,929,464 people shows a weak negative correlation between the proportion of Immigrants from Uruguay and poverty level among children under the age of 16 in the United States with a correlation coefficient (R) of -0.210 and weighted average of 16.8%, a difference of 2.8%.
Child Poverty Under the Age of 16 Correlation Summary
| Measurement | Ethiopian | Immigrants from Uruguay |
| Minimum | 1.2% | 7.0% |
| Maximum | 48.9% | 23.8% |
| Range | 47.6% | 16.8% |
| Mean | 16.3% | 14.9% |
| Median | 15.6% | 15.3% |
| Interquartile 25% (IQ1) | 11.6% | 13.1% |
| Interquartile 75% (IQ3) | 18.0% | 17.6% |
| Interquartile Range (IQR) | 6.3% | 4.5% |
| Standard Deviation (Sample) | 8.6% | 4.2% |
| Standard Deviation (Population) | 8.5% | 4.1% |
Demographics Similar to Ethiopians and Immigrants from Uruguay by Child Poverty Under the Age of 16
In terms of child poverty under the age of 16, the demographic groups most similar to Ethiopians are Immigrants from Ethiopia (16.4%, a difference of 0.13%), Immigrants from Syria (16.4%, a difference of 0.13%), South American Indian (16.4%, a difference of 0.19%), Lebanese (16.3%, a difference of 0.30%), and Immigrants from South America (16.4%, a difference of 0.31%). Similarly, the demographic groups most similar to Immigrants from Uruguay are Spaniard (16.8%, a difference of 0.020%), Immigrants from Uganda (16.8%, a difference of 0.090%), Spanish (16.7%, a difference of 0.22%), Immigrants from Iraq (16.7%, a difference of 0.80%), and Immigrants from Costa Rica (16.6%, a difference of 0.99%).
| Demographics | Rating | Rank | Child Poverty Under the Age of 16 |
| Scotch-Irish | 47.1 /100 | #175 | Average 16.3% |
| Lebanese | 45.9 /100 | #176 | Average 16.3% |
| Ethiopians | 43.4 /100 | #177 | Average 16.3% |
| Immigrants | Ethiopia | 42.3 /100 | #178 | Average 16.4% |
| Immigrants | Syria | 42.3 /100 | #179 | Average 16.4% |
| South American Indians | 41.8 /100 | #180 | Average 16.4% |
| Immigrants | South America | 40.8 /100 | #181 | Average 16.4% |
| Hawaiians | 38.2 /100 | #182 | Fair 16.4% |
| Celtics | 38.2 /100 | #183 | Fair 16.4% |
| Immigrants | Western Asia | 38.0 /100 | #184 | Fair 16.4% |
| Immigrants | Bosnia and Herzegovina | 37.4 /100 | #185 | Fair 16.5% |
| Kenyans | 34.1 /100 | #186 | Fair 16.5% |
| Arabs | 31.4 /100 | #187 | Fair 16.6% |
| Immigrants | Morocco | 31.2 /100 | #188 | Fair 16.6% |
| Immigrants | Portugal | 30.0 /100 | #189 | Fair 16.6% |
| Immigrants | Costa Rica | 29.6 /100 | #190 | Fair 16.6% |
| Immigrants | Iraq | 28.3 /100 | #191 | Fair 16.7% |
| Spanish | 24.5 /100 | #192 | Fair 16.7% |
| Spaniards | 23.2 /100 | #193 | Fair 16.8% |
| Immigrants | Uruguay | 23.1 /100 | #194 | Fair 16.8% |
| Immigrants | Uganda | 22.5 /100 | #195 | Fair 16.8% |