Ecuadorian vs Somali 11th Grade
COMPARE
Ecuadorian
Somali
11th Grade
11th Grade Comparison
Ecuadorians
Somalis
89.6%
11TH GRADE
0.0/ 100
METRIC RATING
306th/ 347
METRIC RANK
92.1%
11TH GRADE
11.6/ 100
METRIC RATING
216th/ 347
METRIC RANK
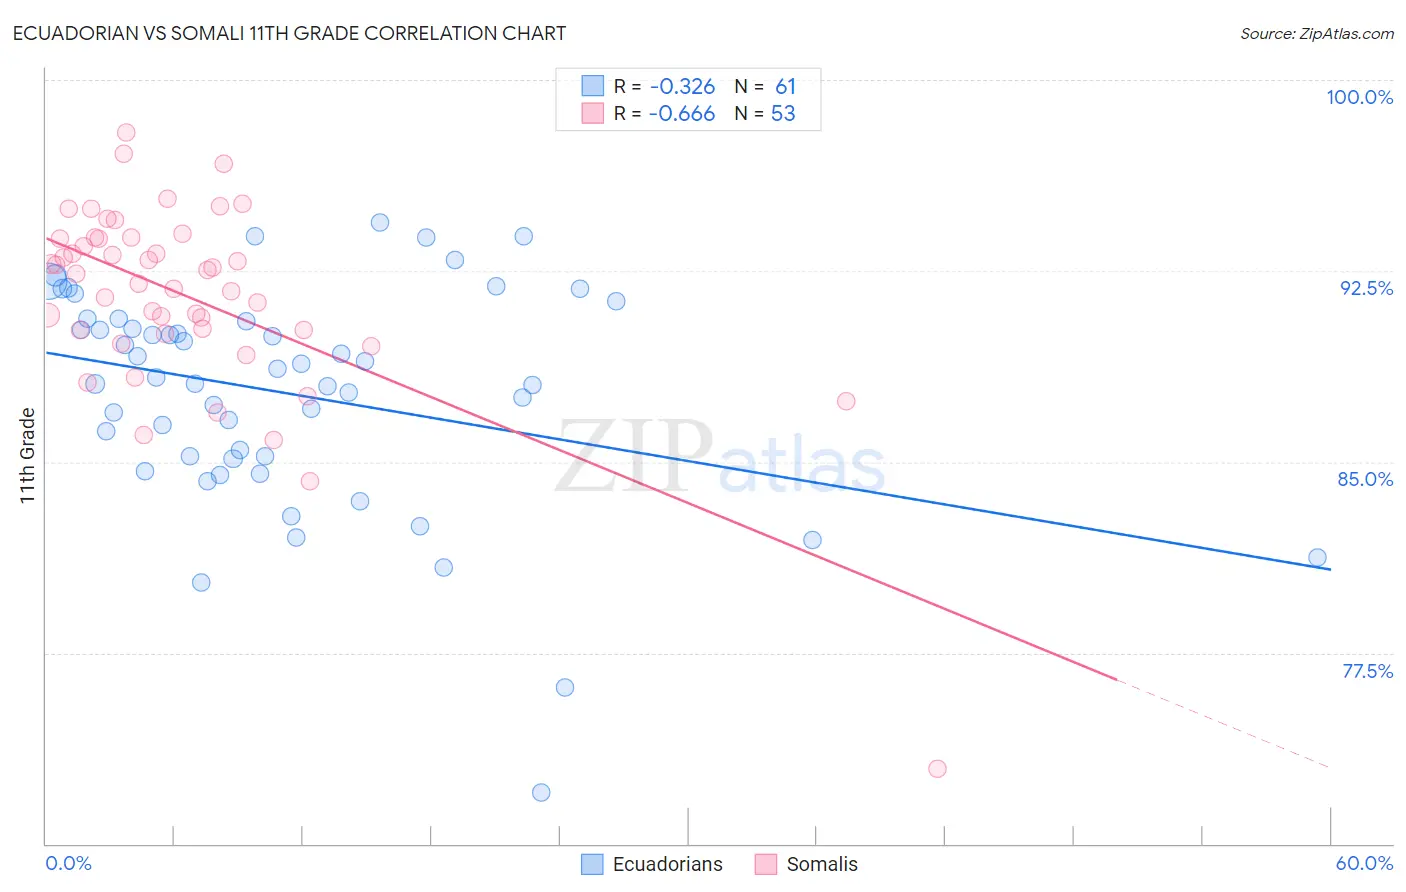
Ecuadorian vs Somali 11th Grade Correlation Chart
The statistical analysis conducted on geographies consisting of 317,753,005 people shows a mild negative correlation between the proportion of Ecuadorians and percentage of population with at least 11th grade education in the United States with a correlation coefficient (R) of -0.326 and weighted average of 89.6%. Similarly, the statistical analysis conducted on geographies consisting of 99,330,527 people shows a significant negative correlation between the proportion of Somalis and percentage of population with at least 11th grade education in the United States with a correlation coefficient (R) of -0.666 and weighted average of 92.1%, a difference of 2.8%.
11th Grade Correlation Summary
| Measurement | Ecuadorian | Somali |
| Minimum | 72.0% | 72.9% |
| Maximum | 94.4% | 98.0% |
| Range | 22.4% | 25.0% |
| Mean | 87.7% | 91.5% |
| Median | 88.3% | 92.4% |
| Interquartile 25% (IQ1) | 85.2% | 90.1% |
| Interquartile 75% (IQ3) | 90.6% | 93.8% |
| Interquartile Range (IQR) | 5.4% | 3.7% |
| Standard Deviation (Sample) | 4.3% | 3.9% |
| Standard Deviation (Population) | 4.3% | 3.9% |
Similar Demographics by 11th Grade
Demographics Similar to Ecuadorians by 11th Grade
In terms of 11th grade, the demographic groups most similar to Ecuadorians are Immigrants from Cambodia (89.6%, a difference of 0.050%), Immigrants from Dominica (89.5%, a difference of 0.050%), Nepalese (89.5%, a difference of 0.070%), Immigrants from Bangladesh (89.5%, a difference of 0.10%), and Yaqui (89.5%, a difference of 0.11%).
| Demographics | Rating | Rank | 11th Grade |
| Japanese | 0.0 /100 | #299 | Tragic 89.9% |
| Immigrants | Haiti | 0.0 /100 | #300 | Tragic 89.9% |
| Guyanese | 0.0 /100 | #301 | Tragic 89.9% |
| Immigrants | Guyana | 0.0 /100 | #302 | Tragic 89.7% |
| Immigrants | Immigrants | 0.0 /100 | #303 | Tragic 89.7% |
| Yuman | 0.0 /100 | #304 | Tragic 89.7% |
| Immigrants | Cambodia | 0.0 /100 | #305 | Tragic 89.6% |
| Ecuadorians | 0.0 /100 | #306 | Tragic 89.6% |
| Immigrants | Dominica | 0.0 /100 | #307 | Tragic 89.5% |
| Nepalese | 0.0 /100 | #308 | Tragic 89.5% |
| Immigrants | Bangladesh | 0.0 /100 | #309 | Tragic 89.5% |
| Yaqui | 0.0 /100 | #310 | Tragic 89.5% |
| Vietnamese | 0.0 /100 | #311 | Tragic 89.4% |
| Immigrants | Portugal | 0.0 /100 | #312 | Tragic 89.3% |
| Immigrants | Caribbean | 0.0 /100 | #313 | Tragic 89.1% |
Demographics Similar to Somalis by 11th Grade
In terms of 11th grade, the demographic groups most similar to Somalis are Immigrants from Sierra Leone (92.0%, a difference of 0.010%), Immigrants from Southern Europe (92.1%, a difference of 0.020%), Afghan (92.1%, a difference of 0.030%), Blackfeet (92.0%, a difference of 0.040%), and Portuguese (92.0%, a difference of 0.040%).
| Demographics | Rating | Rank | 11th Grade |
| Tongans | 19.8 /100 | #209 | Poor 92.2% |
| Ethiopians | 18.8 /100 | #210 | Poor 92.2% |
| Immigrants | Micronesia | 17.7 /100 | #211 | Poor 92.2% |
| Koreans | 14.4 /100 | #212 | Poor 92.1% |
| Immigrants | Ethiopia | 13.9 /100 | #213 | Poor 92.1% |
| Afghans | 12.8 /100 | #214 | Poor 92.1% |
| Immigrants | Southern Europe | 12.5 /100 | #215 | Poor 92.1% |
| Somalis | 11.6 /100 | #216 | Poor 92.1% |
| Immigrants | Sierra Leone | 11.1 /100 | #217 | Poor 92.0% |
| Blackfeet | 10.1 /100 | #218 | Poor 92.0% |
| Portuguese | 10.0 /100 | #219 | Tragic 92.0% |
| South American Indians | 7.6 /100 | #220 | Tragic 92.0% |
| Immigrants | Liberia | 7.0 /100 | #221 | Tragic 91.9% |
| Immigrants | Africa | 6.5 /100 | #222 | Tragic 91.9% |
| Immigrants | Bahamas | 6.5 /100 | #223 | Tragic 91.9% |