Estonian vs Afghan No Vehicles in Household
COMPARE
Estonian
Afghan
No Vehicles in Household
No Vehicles in Household Comparison
Estonians
Afghans
9.8%
NO VEHICLES IN HOUSEHOLD
84.2/ 100
METRIC RATING
138th/ 347
METRIC RANK
8.0%
NO VEHICLES IN HOUSEHOLD
99.9/ 100
METRIC RATING
48th/ 347
METRIC RANK
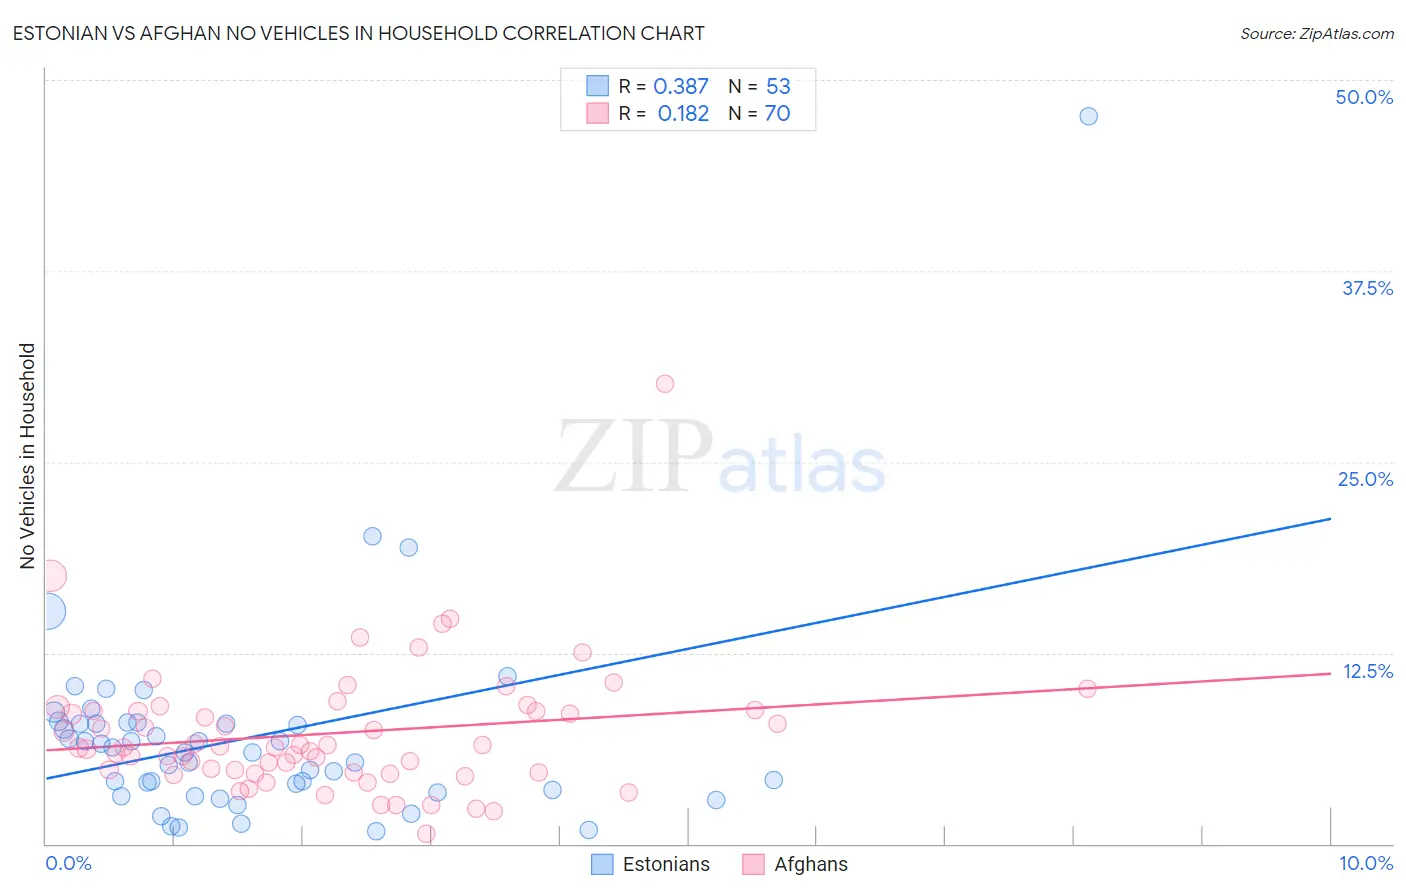
Estonian vs Afghan No Vehicles in Household Correlation Chart
The statistical analysis conducted on geographies consisting of 123,433,435 people shows a mild positive correlation between the proportion of Estonians and percentage of households with no vehicle available in the United States with a correlation coefficient (R) of 0.387 and weighted average of 9.8%. Similarly, the statistical analysis conducted on geographies consisting of 148,777,308 people shows a poor positive correlation between the proportion of Afghans and percentage of households with no vehicle available in the United States with a correlation coefficient (R) of 0.182 and weighted average of 8.0%, a difference of 23.2%.
No Vehicles in Household Correlation Summary
| Measurement | Estonian | Afghan |
| Minimum | 0.84% | 0.64% |
| Maximum | 47.6% | 30.1% |
| Range | 46.8% | 29.5% |
| Mean | 7.0% | 7.2% |
| Median | 6.0% | 6.3% |
| Interquartile 25% (IQ1) | 3.4% | 4.7% |
| Interquartile 75% (IQ3) | 7.9% | 8.7% |
| Interquartile Range (IQR) | 4.5% | 4.0% |
| Standard Deviation (Sample) | 7.0% | 4.3% |
| Standard Deviation (Population) | 6.9% | 4.2% |
Similar Demographics by No Vehicles in Household
Demographics Similar to Estonians by No Vehicles in Household
In terms of no vehicles in household, the demographic groups most similar to Estonians are Marshallese (9.8%, a difference of 0.050%), Immigrants from Lithuania (9.8%, a difference of 0.060%), Immigrants from Moldova (9.8%, a difference of 0.12%), Immigrants from South Africa (9.8%, a difference of 0.21%), and Latvian (9.8%, a difference of 0.27%).
| Demographics | Rating | Rank | No Vehicles in Household |
| Immigrants | Azores | 88.2 /100 | #131 | Excellent 9.7% |
| Kenyans | 88.0 /100 | #132 | Excellent 9.7% |
| Immigrants | Oceania | 87.1 /100 | #133 | Excellent 9.7% |
| Syrians | 87.1 /100 | #134 | Excellent 9.7% |
| Latvians | 85.1 /100 | #135 | Excellent 9.8% |
| Immigrants | South Africa | 85.0 /100 | #136 | Excellent 9.8% |
| Immigrants | Moldova | 84.6 /100 | #137 | Excellent 9.8% |
| Estonians | 84.2 /100 | #138 | Excellent 9.8% |
| Marshallese | 84.0 /100 | #139 | Excellent 9.8% |
| Immigrants | Lithuania | 84.0 /100 | #140 | Excellent 9.8% |
| Sudanese | 83.1 /100 | #141 | Excellent 9.8% |
| Immigrants | Zimbabwe | 82.6 /100 | #142 | Excellent 9.9% |
| Chileans | 81.2 /100 | #143 | Excellent 9.9% |
| Immigrants | Bahamas | 81.2 /100 | #144 | Excellent 9.9% |
| Bahamians | 81.0 /100 | #145 | Excellent 9.9% |
Demographics Similar to Afghans by No Vehicles in Household
In terms of no vehicles in household, the demographic groups most similar to Afghans are Guamanian/Chamorro (8.0%, a difference of 0.17%), Belgian (8.0%, a difference of 0.25%), Korean (8.0%, a difference of 0.34%), Northern European (7.9%, a difference of 0.47%), and Spanish (7.9%, a difference of 0.59%).
| Demographics | Rating | Rank | No Vehicles in Household |
| French Canadians | 99.9 /100 | #41 | Exceptional 7.8% |
| Swiss | 99.9 /100 | #42 | Exceptional 7.9% |
| Chickasaw | 99.9 /100 | #43 | Exceptional 7.9% |
| Choctaw | 99.9 /100 | #44 | Exceptional 7.9% |
| Immigrants | Nonimmigrants | 99.9 /100 | #45 | Exceptional 7.9% |
| Spanish | 99.9 /100 | #46 | Exceptional 7.9% |
| Northern Europeans | 99.9 /100 | #47 | Exceptional 7.9% |
| Afghans | 99.9 /100 | #48 | Exceptional 8.0% |
| Guamanians/Chamorros | 99.9 /100 | #49 | Exceptional 8.0% |
| Belgians | 99.9 /100 | #50 | Exceptional 8.0% |
| Koreans | 99.9 /100 | #51 | Exceptional 8.0% |
| Hawaiians | 99.9 /100 | #52 | Exceptional 8.0% |
| Slovenes | 99.9 /100 | #53 | Exceptional 8.0% |
| Immigrants | Venezuela | 99.9 /100 | #54 | Exceptional 8.1% |
| Celtics | 99.9 /100 | #55 | Exceptional 8.1% |