Immigrants from Kazakhstan vs Afghan No Vehicles in Household
COMPARE
Immigrants from Kazakhstan
Afghan
No Vehicles in Household
No Vehicles in Household Comparison
Immigrants from Kazakhstan
Afghans
13.6%
NO VEHICLES IN HOUSEHOLD
0.0/ 100
METRIC RATING
283rd/ 347
METRIC RANK
8.0%
NO VEHICLES IN HOUSEHOLD
99.9/ 100
METRIC RATING
48th/ 347
METRIC RANK
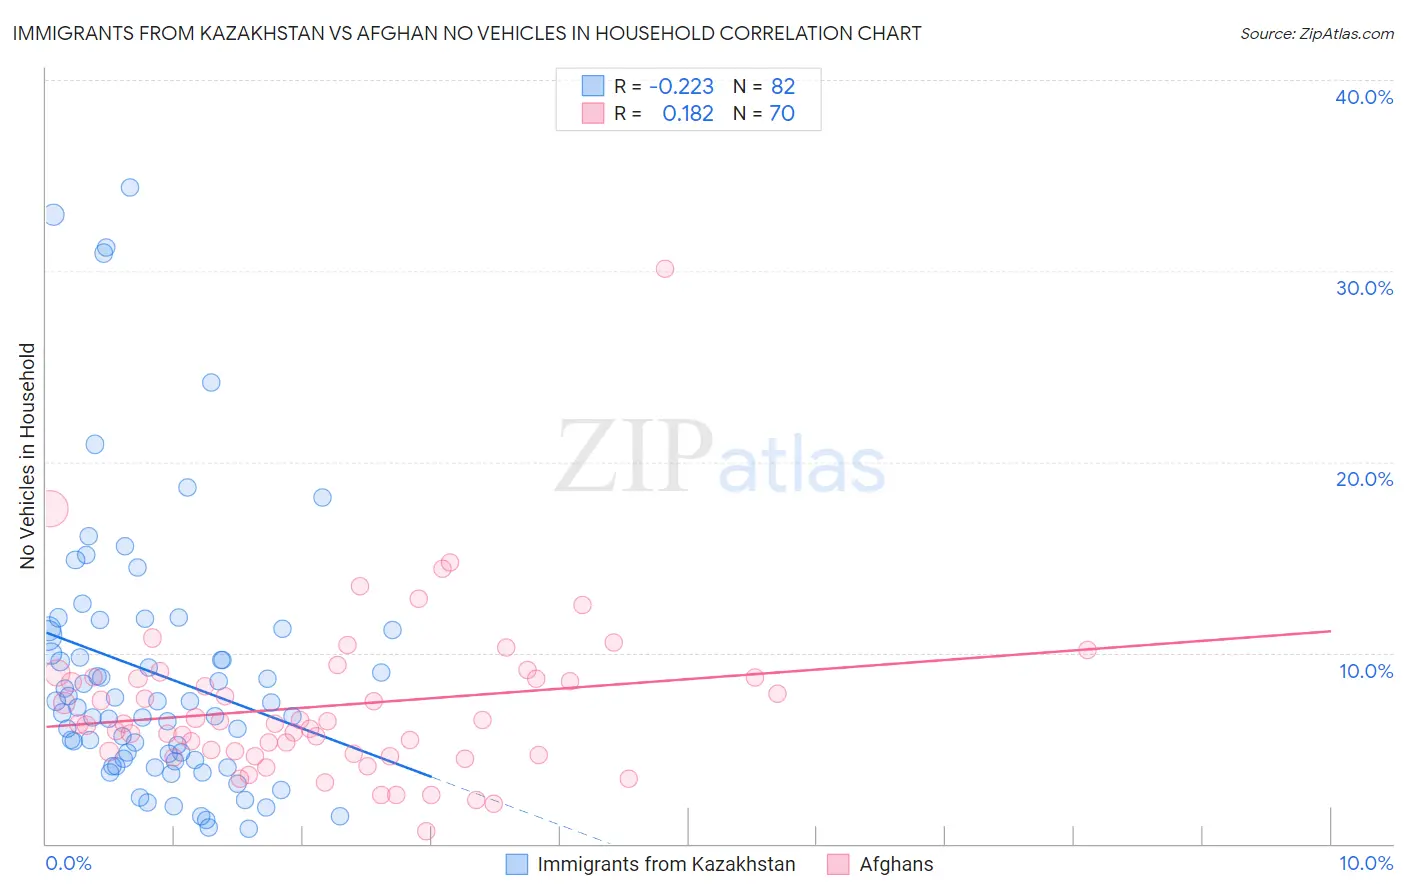
Immigrants from Kazakhstan vs Afghan No Vehicles in Household Correlation Chart
The statistical analysis conducted on geographies consisting of 124,281,418 people shows a weak negative correlation between the proportion of Immigrants from Kazakhstan and percentage of households with no vehicle available in the United States with a correlation coefficient (R) of -0.223 and weighted average of 13.6%. Similarly, the statistical analysis conducted on geographies consisting of 148,777,308 people shows a poor positive correlation between the proportion of Afghans and percentage of households with no vehicle available in the United States with a correlation coefficient (R) of 0.182 and weighted average of 8.0%, a difference of 70.1%.
No Vehicles in Household Correlation Summary
| Measurement | Immigrants from Kazakhstan | Afghan |
| Minimum | 0.77% | 0.64% |
| Maximum | 34.4% | 30.1% |
| Range | 33.6% | 29.5% |
| Mean | 8.9% | 7.2% |
| Median | 7.3% | 6.3% |
| Interquartile 25% (IQ1) | 4.4% | 4.7% |
| Interquartile 75% (IQ3) | 11.2% | 8.7% |
| Interquartile Range (IQR) | 6.9% | 4.0% |
| Standard Deviation (Sample) | 7.1% | 4.3% |
| Standard Deviation (Population) | 7.0% | 4.2% |
Similar Demographics by No Vehicles in Household
Demographics Similar to Immigrants from Kazakhstan by No Vehicles in Household
In terms of no vehicles in household, the demographic groups most similar to Immigrants from Kazakhstan are Immigrants from Eastern Asia (13.5%, a difference of 0.040%), Immigrants from Malaysia (13.6%, a difference of 0.24%), Immigrants from Eastern Europe (13.6%, a difference of 0.30%), Colville (13.7%, a difference of 0.96%), and Immigrants from Ireland (13.7%, a difference of 1.2%).
| Demographics | Rating | Rank | No Vehicles in Household |
| Immigrants | Southern Europe | 0.1 /100 | #276 | Tragic 13.0% |
| Aleuts | 0.1 /100 | #277 | Tragic 13.0% |
| Immigrants | Croatia | 0.1 /100 | #278 | Tragic 13.0% |
| Mongolians | 0.0 /100 | #279 | Tragic 13.1% |
| Alsatians | 0.0 /100 | #280 | Tragic 13.2% |
| Central American Indians | 0.0 /100 | #281 | Tragic 13.3% |
| Immigrants | Eastern Asia | 0.0 /100 | #282 | Tragic 13.5% |
| Immigrants | Kazakhstan | 0.0 /100 | #283 | Tragic 13.6% |
| Immigrants | Malaysia | 0.0 /100 | #284 | Tragic 13.6% |
| Immigrants | Eastern Europe | 0.0 /100 | #285 | Tragic 13.6% |
| Colville | 0.0 /100 | #286 | Tragic 13.7% |
| Immigrants | Ireland | 0.0 /100 | #287 | Tragic 13.7% |
| Hopi | 0.0 /100 | #288 | Tragic 13.7% |
| Immigrants | Australia | 0.0 /100 | #289 | Tragic 13.8% |
| Indians (Asian) | 0.0 /100 | #290 | Tragic 14.1% |
Demographics Similar to Afghans by No Vehicles in Household
In terms of no vehicles in household, the demographic groups most similar to Afghans are Guamanian/Chamorro (8.0%, a difference of 0.17%), Belgian (8.0%, a difference of 0.25%), Korean (8.0%, a difference of 0.34%), Northern European (7.9%, a difference of 0.47%), and Spanish (7.9%, a difference of 0.59%).
| Demographics | Rating | Rank | No Vehicles in Household |
| French Canadians | 99.9 /100 | #41 | Exceptional 7.8% |
| Swiss | 99.9 /100 | #42 | Exceptional 7.9% |
| Chickasaw | 99.9 /100 | #43 | Exceptional 7.9% |
| Choctaw | 99.9 /100 | #44 | Exceptional 7.9% |
| Immigrants | Nonimmigrants | 99.9 /100 | #45 | Exceptional 7.9% |
| Spanish | 99.9 /100 | #46 | Exceptional 7.9% |
| Northern Europeans | 99.9 /100 | #47 | Exceptional 7.9% |
| Afghans | 99.9 /100 | #48 | Exceptional 8.0% |
| Guamanians/Chamorros | 99.9 /100 | #49 | Exceptional 8.0% |
| Belgians | 99.9 /100 | #50 | Exceptional 8.0% |
| Koreans | 99.9 /100 | #51 | Exceptional 8.0% |
| Hawaiians | 99.9 /100 | #52 | Exceptional 8.0% |
| Slovenes | 99.9 /100 | #53 | Exceptional 8.0% |
| Immigrants | Venezuela | 99.9 /100 | #54 | Exceptional 8.1% |
| Celtics | 99.9 /100 | #55 | Exceptional 8.1% |