Dominican vs Osage No Vehicles in Household
COMPARE
Dominican
Osage
No Vehicles in Household
No Vehicles in Household Comparison
Dominicans
Osage
29.4%
NO VEHICLES IN HOUSEHOLD
0.0/ 100
METRIC RATING
339th/ 347
METRIC RANK
8.7%
NO VEHICLES IN HOUSEHOLD
99.2/ 100
METRIC RATING
88th/ 347
METRIC RANK
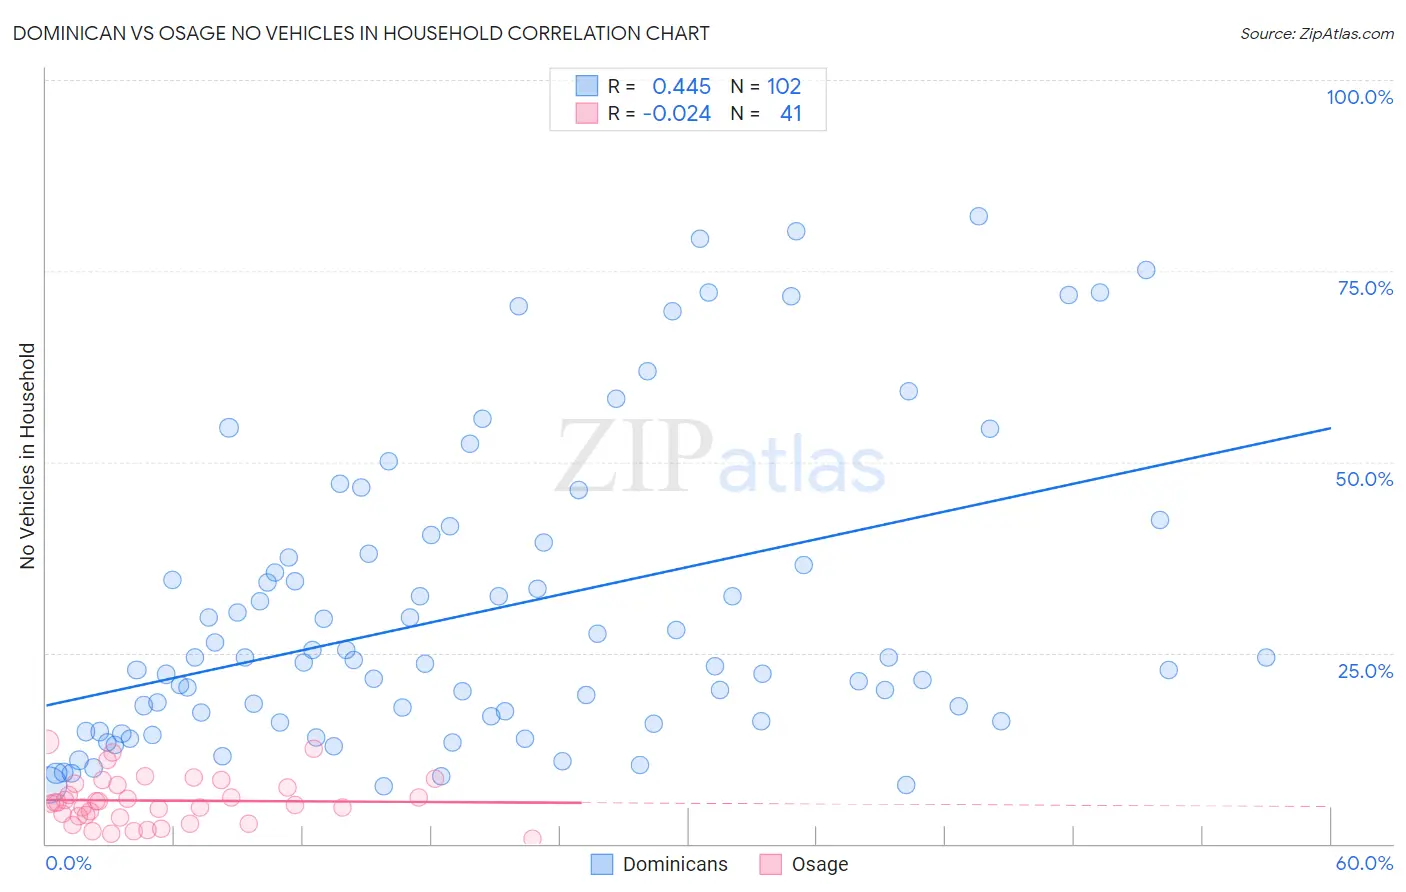
Dominican vs Osage No Vehicles in Household Correlation Chart
The statistical analysis conducted on geographies consisting of 354,220,485 people shows a moderate positive correlation between the proportion of Dominicans and percentage of households with no vehicle available in the United States with a correlation coefficient (R) of 0.445 and weighted average of 29.4%. Similarly, the statistical analysis conducted on geographies consisting of 91,756,472 people shows no correlation between the proportion of Osage and percentage of households with no vehicle available in the United States with a correlation coefficient (R) of -0.024 and weighted average of 8.7%, a difference of 238.3%.
No Vehicles in Household Correlation Summary
| Measurement | Dominican | Osage |
| Minimum | 7.6% | 0.66% |
| Maximum | 82.1% | 13.3% |
| Range | 74.5% | 12.7% |
| Mean | 30.4% | 5.6% |
| Median | 23.8% | 5.4% |
| Interquartile 25% (IQ1) | 16.0% | 3.5% |
| Interquartile 75% (IQ3) | 38.0% | 7.7% |
| Interquartile Range (IQR) | 22.0% | 4.2% |
| Standard Deviation (Sample) | 19.5% | 3.1% |
| Standard Deviation (Population) | 19.4% | 3.1% |
Similar Demographics by No Vehicles in Household
Demographics Similar to Dominicans by No Vehicles in Household
In terms of no vehicles in household, the demographic groups most similar to Dominicans are Immigrants from Barbados (29.5%, a difference of 0.23%), Immigrants from Guyana (29.5%, a difference of 0.28%), Guyanese (29.3%, a difference of 0.36%), British West Indian (29.7%, a difference of 1.1%), and Inupiat (29.9%, a difference of 1.5%).
| Demographics | Rating | Rank | No Vehicles in Household |
| Immigrants | Ecuador | 0.0 /100 | #332 | Tragic 23.8% |
| Immigrants | Trinidad and Tobago | 0.0 /100 | #333 | Tragic 24.6% |
| Immigrants | Bangladesh | 0.0 /100 | #334 | Tragic 25.8% |
| Barbadians | 0.0 /100 | #335 | Tragic 26.1% |
| Vietnamese | 0.0 /100 | #336 | Tragic 26.2% |
| Immigrants | Uzbekistan | 0.0 /100 | #337 | Tragic 26.7% |
| Guyanese | 0.0 /100 | #338 | Tragic 29.3% |
| Dominicans | 0.0 /100 | #339 | Tragic 29.4% |
| Immigrants | Barbados | 0.0 /100 | #340 | Tragic 29.5% |
| Immigrants | Guyana | 0.0 /100 | #341 | Tragic 29.5% |
| British West Indians | 0.0 /100 | #342 | Tragic 29.7% |
| Inupiat | 0.0 /100 | #343 | Tragic 29.9% |
| Immigrants | Dominican Republic | 0.0 /100 | #344 | Tragic 31.4% |
| Immigrants | St. Vincent and the Grenadines | 0.0 /100 | #345 | Tragic 35.4% |
| Immigrants | Grenada | 0.0 /100 | #346 | Tragic 37.5% |
Demographics Similar to Osage by No Vehicles in Household
In terms of no vehicles in household, the demographic groups most similar to Osage are Immigrants from England (8.7%, a difference of 0.12%), Immigrants from Cuba (8.7%, a difference of 0.14%), Bhutanese (8.7%, a difference of 0.23%), Bangladeshi (8.7%, a difference of 0.34%), and Immigrants from Germany (8.7%, a difference of 0.42%).
| Demographics | Rating | Rank | No Vehicles in Household |
| Tsimshian | 99.4 /100 | #81 | Exceptional 8.6% |
| Immigrants | South Eastern Asia | 99.4 /100 | #82 | Exceptional 8.6% |
| Italians | 99.4 /100 | #83 | Exceptional 8.6% |
| Immigrants | Jordan | 99.3 /100 | #84 | Exceptional 8.7% |
| Lebanese | 99.3 /100 | #85 | Exceptional 8.7% |
| Bangladeshis | 99.3 /100 | #86 | Exceptional 8.7% |
| Immigrants | England | 99.2 /100 | #87 | Exceptional 8.7% |
| Osage | 99.2 /100 | #88 | Exceptional 8.7% |
| Immigrants | Cuba | 99.2 /100 | #89 | Exceptional 8.7% |
| Bhutanese | 99.2 /100 | #90 | Exceptional 8.7% |
| Immigrants | Germany | 99.1 /100 | #91 | Exceptional 8.7% |
| Immigrants | Canada | 99.1 /100 | #92 | Exceptional 8.7% |
| Immigrants | North America | 99.1 /100 | #93 | Exceptional 8.7% |
| Austrians | 98.9 /100 | #94 | Exceptional 8.8% |
| Potawatomi | 98.8 /100 | #95 | Exceptional 8.8% |