Immigrants from India vs Afghan No Vehicles in Household
COMPARE
Immigrants from India
Afghan
No Vehicles in Household
No Vehicles in Household Comparison
Immigrants from India
Afghans
8.2%
NO VEHICLES IN HOUSEHOLD
99.8/ 100
METRIC RATING
59th/ 347
METRIC RANK
8.0%
NO VEHICLES IN HOUSEHOLD
99.9/ 100
METRIC RATING
48th/ 347
METRIC RANK
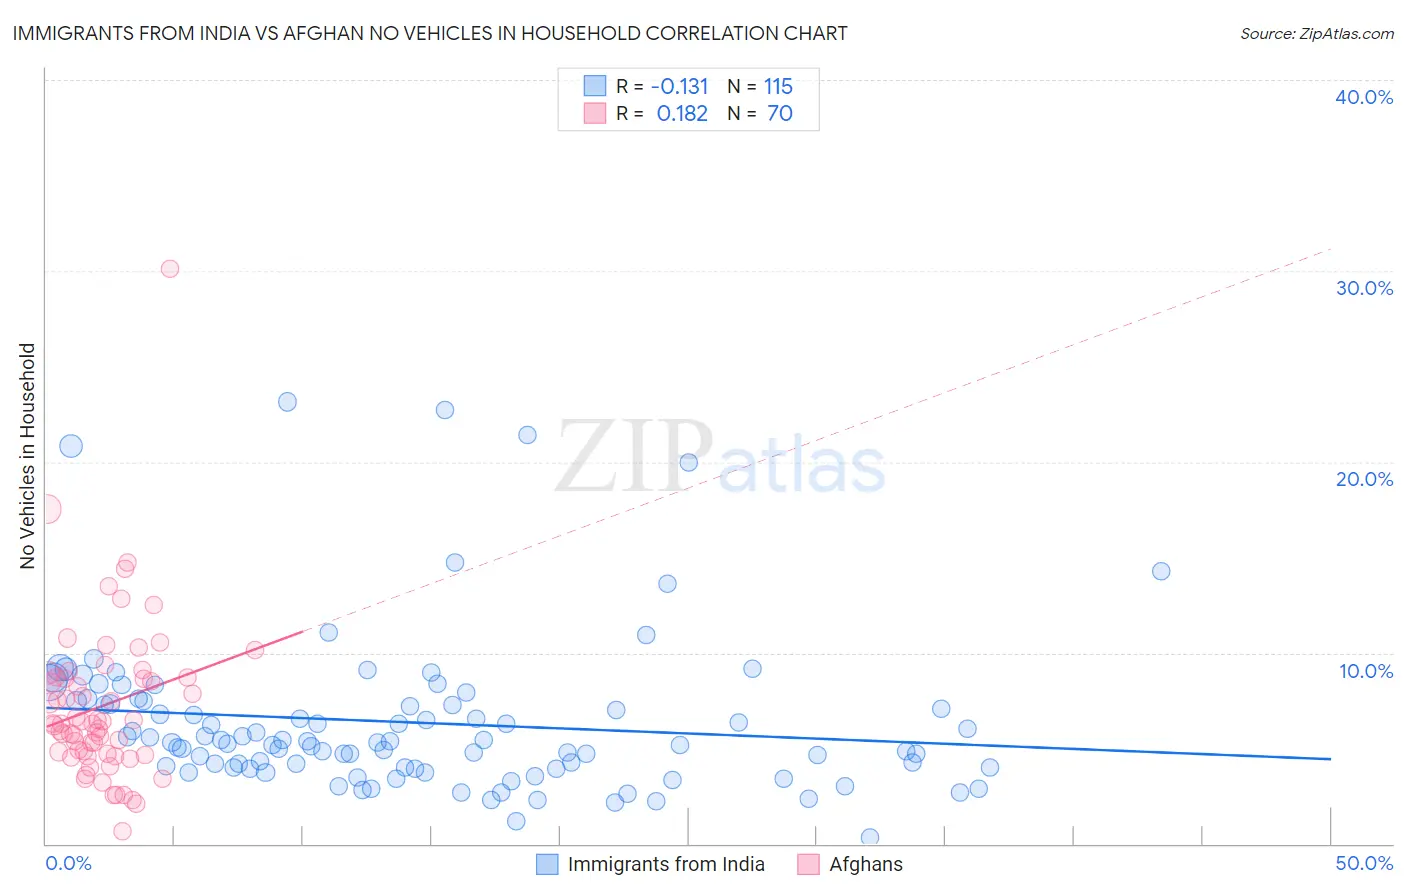
Immigrants from India vs Afghan No Vehicles in Household Correlation Chart
The statistical analysis conducted on geographies consisting of 432,669,586 people shows a poor negative correlation between the proportion of Immigrants from India and percentage of households with no vehicle available in the United States with a correlation coefficient (R) of -0.131 and weighted average of 8.2%. Similarly, the statistical analysis conducted on geographies consisting of 148,777,308 people shows a poor positive correlation between the proportion of Afghans and percentage of households with no vehicle available in the United States with a correlation coefficient (R) of 0.182 and weighted average of 8.0%, a difference of 2.5%.
No Vehicles in Household Correlation Summary
| Measurement | Immigrants from India | Afghan |
| Minimum | 0.34% | 0.64% |
| Maximum | 23.1% | 30.1% |
| Range | 22.8% | 29.5% |
| Mean | 6.4% | 7.2% |
| Median | 5.3% | 6.3% |
| Interquartile 25% (IQ1) | 4.0% | 4.7% |
| Interquartile 75% (IQ3) | 7.5% | 8.7% |
| Interquartile Range (IQR) | 3.5% | 4.0% |
| Standard Deviation (Sample) | 4.1% | 4.3% |
| Standard Deviation (Population) | 4.1% | 4.2% |
Demographics Similar to Immigrants from India and Afghans by No Vehicles in Household
In terms of no vehicles in household, the demographic groups most similar to Immigrants from India are Immigrants from Laos (8.2%, a difference of 0.070%), Thai (8.2%, a difference of 0.24%), Immigrants from Mexico (8.1%, a difference of 0.35%), Venezuelan (8.1%, a difference of 0.46%), and Chinese (8.2%, a difference of 0.69%). Similarly, the demographic groups most similar to Afghans are Guamanian/Chamorro (8.0%, a difference of 0.17%), Belgian (8.0%, a difference of 0.25%), Korean (8.0%, a difference of 0.34%), Northern European (7.9%, a difference of 0.47%), and Spanish (7.9%, a difference of 0.59%).
| Demographics | Rating | Rank | No Vehicles in Household |
| Chickasaw | 99.9 /100 | #43 | Exceptional 7.9% |
| Choctaw | 99.9 /100 | #44 | Exceptional 7.9% |
| Immigrants | Nonimmigrants | 99.9 /100 | #45 | Exceptional 7.9% |
| Spanish | 99.9 /100 | #46 | Exceptional 7.9% |
| Northern Europeans | 99.9 /100 | #47 | Exceptional 7.9% |
| Afghans | 99.9 /100 | #48 | Exceptional 8.0% |
| Guamanians/Chamorros | 99.9 /100 | #49 | Exceptional 8.0% |
| Belgians | 99.9 /100 | #50 | Exceptional 8.0% |
| Koreans | 99.9 /100 | #51 | Exceptional 8.0% |
| Hawaiians | 99.9 /100 | #52 | Exceptional 8.0% |
| Slovenes | 99.9 /100 | #53 | Exceptional 8.0% |
| Immigrants | Venezuela | 99.9 /100 | #54 | Exceptional 8.1% |
| Celtics | 99.9 /100 | #55 | Exceptional 8.1% |
| Immigrants | Afghanistan | 99.9 /100 | #56 | Exceptional 8.1% |
| Venezuelans | 99.8 /100 | #57 | Exceptional 8.1% |
| Immigrants | Mexico | 99.8 /100 | #58 | Exceptional 8.1% |
| Immigrants | India | 99.8 /100 | #59 | Exceptional 8.2% |
| Immigrants | Laos | 99.8 /100 | #60 | Exceptional 8.2% |
| Thais | 99.8 /100 | #61 | Exceptional 8.2% |
| Chinese | 99.8 /100 | #62 | Exceptional 8.2% |
| Slovaks | 99.8 /100 | #63 | Exceptional 8.3% |