Immigrants from Sri Lanka vs Afghan No Vehicles in Household
COMPARE
Immigrants from Sri Lanka
Afghan
No Vehicles in Household
No Vehicles in Household Comparison
Immigrants from Sri Lanka
Afghans
11.2%
NO VEHICLES IN HOUSEHOLD
10.6/ 100
METRIC RATING
215th/ 347
METRIC RANK
8.0%
NO VEHICLES IN HOUSEHOLD
99.9/ 100
METRIC RATING
48th/ 347
METRIC RANK
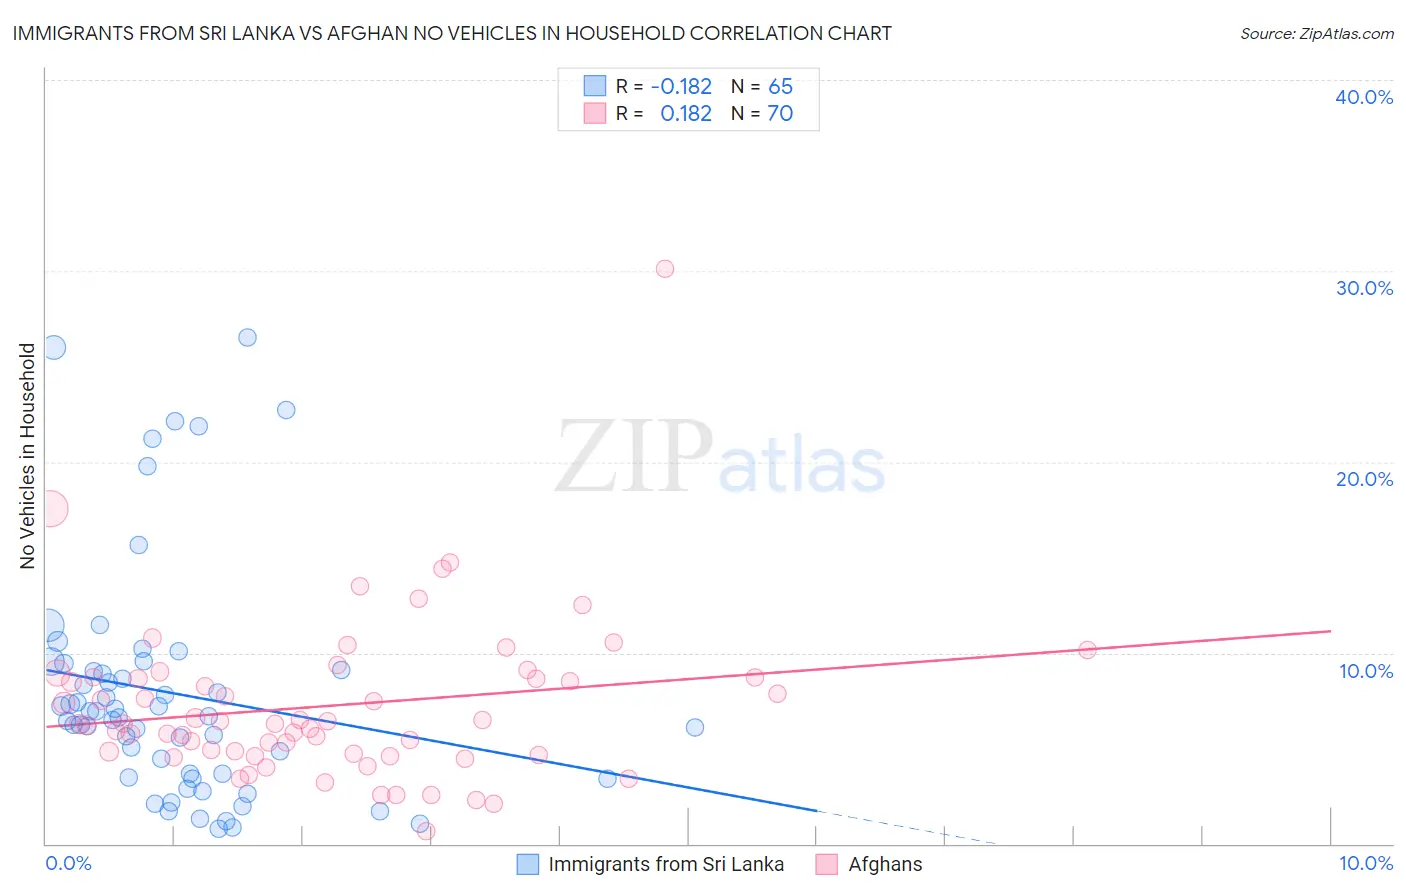
Immigrants from Sri Lanka vs Afghan No Vehicles in Household Correlation Chart
The statistical analysis conducted on geographies consisting of 149,629,473 people shows a poor negative correlation between the proportion of Immigrants from Sri Lanka and percentage of households with no vehicle available in the United States with a correlation coefficient (R) of -0.182 and weighted average of 11.2%. Similarly, the statistical analysis conducted on geographies consisting of 148,777,308 people shows a poor positive correlation between the proportion of Afghans and percentage of households with no vehicle available in the United States with a correlation coefficient (R) of 0.182 and weighted average of 8.0%, a difference of 40.0%.
No Vehicles in Household Correlation Summary
| Measurement | Immigrants from Sri Lanka | Afghan |
| Minimum | 0.78% | 0.64% |
| Maximum | 26.5% | 30.1% |
| Range | 25.7% | 29.5% |
| Mean | 7.9% | 7.2% |
| Median | 6.6% | 6.3% |
| Interquartile 25% (IQ1) | 3.5% | 4.7% |
| Interquartile 75% (IQ3) | 9.3% | 8.7% |
| Interquartile Range (IQR) | 5.7% | 4.0% |
| Standard Deviation (Sample) | 6.1% | 4.3% |
| Standard Deviation (Population) | 6.1% | 4.2% |
Similar Demographics by No Vehicles in Household
Demographics Similar to Immigrants from Sri Lanka by No Vehicles in Household
In terms of no vehicles in household, the demographic groups most similar to Immigrants from Sri Lanka are Immigrants from Argentina (11.2%, a difference of 0.0%), Dutch West Indian (11.2%, a difference of 0.13%), Immigrants from Guatemala (11.2%, a difference of 0.23%), Argentinean (11.2%, a difference of 0.35%), and Immigrants from Zaire (11.2%, a difference of 0.37%).
| Demographics | Rating | Rank | No Vehicles in Household |
| Immigrants | Italy | 15.6 /100 | #208 | Poor 11.0% |
| Pennsylvania Germans | 15.5 /100 | #209 | Poor 11.0% |
| Apache | 14.8 /100 | #210 | Poor 11.0% |
| Crow | 14.2 /100 | #211 | Poor 11.0% |
| Immigrants | Western Asia | 13.9 /100 | #212 | Poor 11.0% |
| Immigrants | Hungary | 12.3 /100 | #213 | Poor 11.1% |
| Immigrants | Denmark | 12.1 /100 | #214 | Poor 11.1% |
| Immigrants | Sri Lanka | 10.6 /100 | #215 | Poor 11.2% |
| Immigrants | Argentina | 10.6 /100 | #216 | Poor 11.2% |
| Dutch West Indians | 10.2 /100 | #217 | Poor 11.2% |
| Immigrants | Guatemala | 10.0 /100 | #218 | Tragic 11.2% |
| Argentineans | 9.6 /100 | #219 | Tragic 11.2% |
| Immigrants | Zaire | 9.6 /100 | #220 | Tragic 11.2% |
| Peruvians | 8.4 /100 | #221 | Tragic 11.2% |
| Immigrants | South America | 8.0 /100 | #222 | Tragic 11.3% |
Demographics Similar to Afghans by No Vehicles in Household
In terms of no vehicles in household, the demographic groups most similar to Afghans are Guamanian/Chamorro (8.0%, a difference of 0.17%), Belgian (8.0%, a difference of 0.25%), Korean (8.0%, a difference of 0.34%), Northern European (7.9%, a difference of 0.47%), and Spanish (7.9%, a difference of 0.59%).
| Demographics | Rating | Rank | No Vehicles in Household |
| French Canadians | 99.9 /100 | #41 | Exceptional 7.8% |
| Swiss | 99.9 /100 | #42 | Exceptional 7.9% |
| Chickasaw | 99.9 /100 | #43 | Exceptional 7.9% |
| Choctaw | 99.9 /100 | #44 | Exceptional 7.9% |
| Immigrants | Nonimmigrants | 99.9 /100 | #45 | Exceptional 7.9% |
| Spanish | 99.9 /100 | #46 | Exceptional 7.9% |
| Northern Europeans | 99.9 /100 | #47 | Exceptional 7.9% |
| Afghans | 99.9 /100 | #48 | Exceptional 8.0% |
| Guamanians/Chamorros | 99.9 /100 | #49 | Exceptional 8.0% |
| Belgians | 99.9 /100 | #50 | Exceptional 8.0% |
| Koreans | 99.9 /100 | #51 | Exceptional 8.0% |
| Hawaiians | 99.9 /100 | #52 | Exceptional 8.0% |
| Slovenes | 99.9 /100 | #53 | Exceptional 8.0% |
| Immigrants | Venezuela | 99.9 /100 | #54 | Exceptional 8.1% |
| Celtics | 99.9 /100 | #55 | Exceptional 8.1% |