Dominican vs Alaska Native No Vehicles in Household
COMPARE
Dominican
Alaska Native
No Vehicles in Household
No Vehicles in Household Comparison
Dominicans
Alaska Natives
29.4%
NO VEHICLES IN HOUSEHOLD
0.0/ 100
METRIC RATING
339th/ 347
METRIC RANK
17.4%
NO VEHICLES IN HOUSEHOLD
0.0/ 100
METRIC RATING
319th/ 347
METRIC RANK
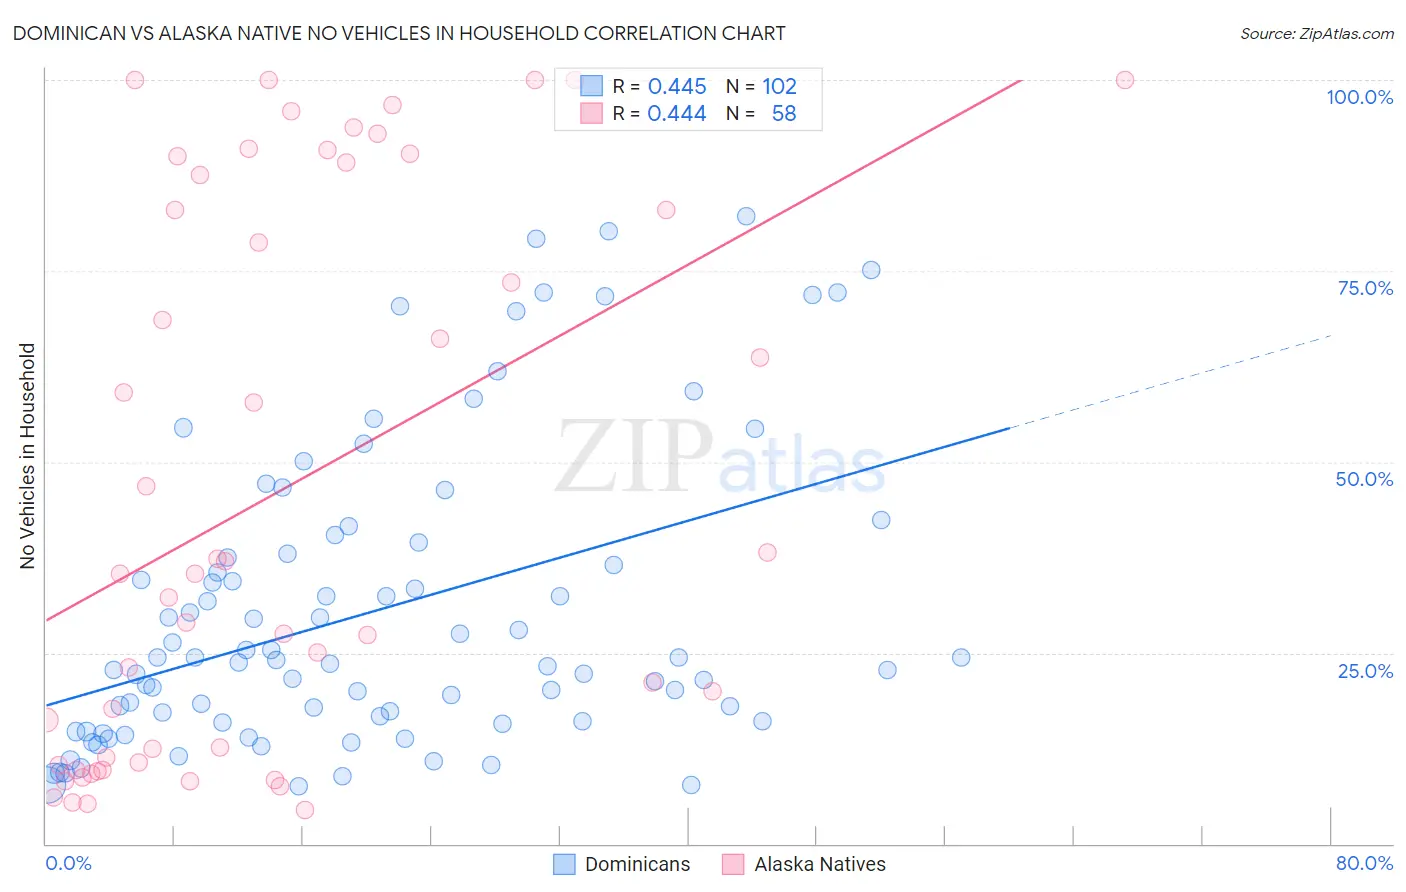
Dominican vs Alaska Native No Vehicles in Household Correlation Chart
The statistical analysis conducted on geographies consisting of 354,220,485 people shows a moderate positive correlation between the proportion of Dominicans and percentage of households with no vehicle available in the United States with a correlation coefficient (R) of 0.445 and weighted average of 29.4%. Similarly, the statistical analysis conducted on geographies consisting of 76,683,354 people shows a moderate positive correlation between the proportion of Alaska Natives and percentage of households with no vehicle available in the United States with a correlation coefficient (R) of 0.444 and weighted average of 17.4%, a difference of 69.0%.
No Vehicles in Household Correlation Summary
| Measurement | Dominican | Alaska Native |
| Minimum | 7.6% | 4.5% |
| Maximum | 82.1% | 100.0% |
| Range | 74.5% | 95.5% |
| Mean | 30.4% | 46.2% |
| Median | 23.8% | 35.3% |
| Interquartile 25% (IQ1) | 16.0% | 10.7% |
| Interquartile 75% (IQ3) | 38.0% | 87.5% |
| Interquartile Range (IQR) | 22.0% | 76.8% |
| Standard Deviation (Sample) | 19.5% | 35.6% |
| Standard Deviation (Population) | 19.4% | 35.3% |
Demographics Similar to Dominicans and Alaska Natives by No Vehicles in Household
In terms of no vehicles in household, the demographic groups most similar to Dominicans are Guyanese (29.3%, a difference of 0.36%), Immigrants from Uzbekistan (26.7%, a difference of 10.3%), Vietnamese (26.2%, a difference of 12.1%), Barbadian (26.1%, a difference of 12.7%), and Immigrants from Bangladesh (25.8%, a difference of 14.2%). Similarly, the demographic groups most similar to Alaska Natives are Soviet Union (17.4%, a difference of 0.16%), Jamaican (17.9%, a difference of 3.0%), Immigrants from Cabo Verde (18.4%, a difference of 6.0%), Immigrants from Yemen (19.5%, a difference of 11.9%), and Immigrants from Caribbean (19.6%, a difference of 12.7%).
| Demographics | Rating | Rank | No Vehicles in Household |
| Alaska Natives | 0.0 /100 | #319 | Tragic 17.4% |
| Soviet Union | 0.0 /100 | #320 | Tragic 17.4% |
| Jamaicans | 0.0 /100 | #321 | Tragic 17.9% |
| Immigrants | Cabo Verde | 0.0 /100 | #322 | Tragic 18.4% |
| Immigrants | Yemen | 0.0 /100 | #323 | Tragic 19.5% |
| Immigrants | Caribbean | 0.0 /100 | #324 | Tragic 19.6% |
| Senegalese | 0.0 /100 | #325 | Tragic 19.8% |
| Immigrants | West Indies | 0.0 /100 | #326 | Tragic 20.5% |
| Immigrants | Senegal | 0.0 /100 | #327 | Tragic 21.1% |
| Immigrants | Dominica | 0.0 /100 | #328 | Tragic 22.2% |
| Ecuadorians | 0.0 /100 | #329 | Tragic 22.8% |
| West Indians | 0.0 /100 | #330 | Tragic 23.7% |
| Trinidadians and Tobagonians | 0.0 /100 | #331 | Tragic 23.7% |
| Immigrants | Ecuador | 0.0 /100 | #332 | Tragic 23.8% |
| Immigrants | Trinidad and Tobago | 0.0 /100 | #333 | Tragic 24.6% |
| Immigrants | Bangladesh | 0.0 /100 | #334 | Tragic 25.8% |
| Barbadians | 0.0 /100 | #335 | Tragic 26.1% |
| Vietnamese | 0.0 /100 | #336 | Tragic 26.2% |
| Immigrants | Uzbekistan | 0.0 /100 | #337 | Tragic 26.7% |
| Guyanese | 0.0 /100 | #338 | Tragic 29.3% |
| Dominicans | 0.0 /100 | #339 | Tragic 29.4% |