Dominican vs Navajo No Vehicles in Household
COMPARE
Dominican
Navajo
No Vehicles in Household
No Vehicles in Household Comparison
Dominicans
Navajo
29.4%
NO VEHICLES IN HOUSEHOLD
0.0/ 100
METRIC RATING
339th/ 347
METRIC RANK
9.4%
NO VEHICLES IN HOUSEHOLD
94.2/ 100
METRIC RATING
115th/ 347
METRIC RANK
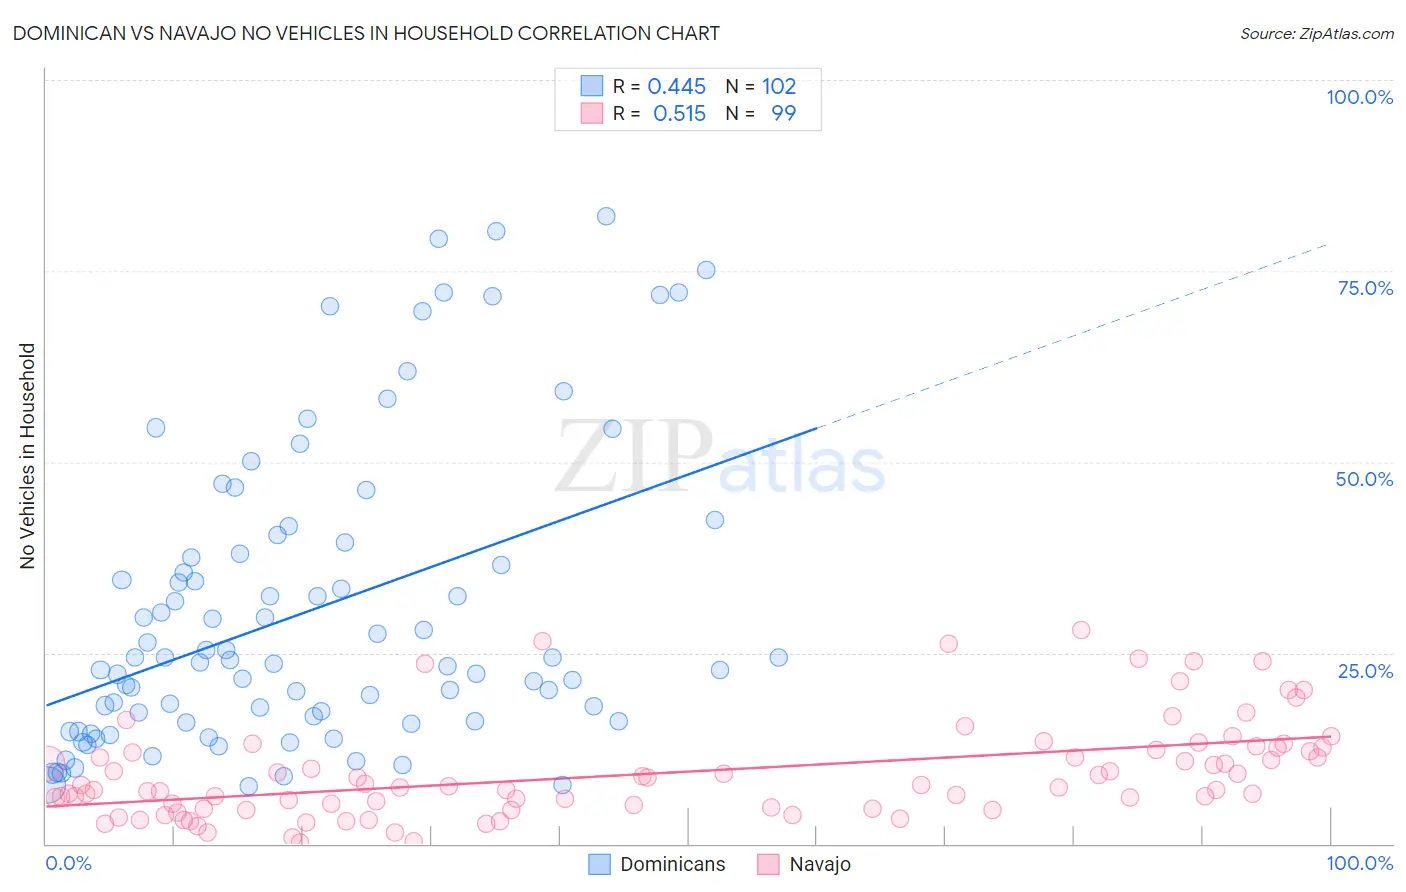
Dominican vs Navajo No Vehicles in Household Correlation Chart
The statistical analysis conducted on geographies consisting of 354,220,485 people shows a moderate positive correlation between the proportion of Dominicans and percentage of households with no vehicle available in the United States with a correlation coefficient (R) of 0.445 and weighted average of 29.4%. Similarly, the statistical analysis conducted on geographies consisting of 224,409,454 people shows a substantial positive correlation between the proportion of Navajo and percentage of households with no vehicle available in the United States with a correlation coefficient (R) of 0.515 and weighted average of 9.4%, a difference of 212.1%.
No Vehicles in Household Correlation Summary
| Measurement | Dominican | Navajo |
| Minimum | 7.6% | 0.12% |
| Maximum | 82.1% | 27.9% |
| Range | 74.5% | 27.8% |
| Mean | 30.4% | 9.3% |
| Median | 23.8% | 7.4% |
| Interquartile 25% (IQ1) | 16.0% | 4.6% |
| Interquartile 75% (IQ3) | 38.0% | 12.3% |
| Interquartile Range (IQR) | 22.0% | 7.8% |
| Standard Deviation (Sample) | 19.5% | 6.3% |
| Standard Deviation (Population) | 19.4% | 6.3% |
Similar Demographics by No Vehicles in Household
Demographics Similar to Dominicans by No Vehicles in Household
In terms of no vehicles in household, the demographic groups most similar to Dominicans are Immigrants from Barbados (29.5%, a difference of 0.23%), Immigrants from Guyana (29.5%, a difference of 0.28%), Guyanese (29.3%, a difference of 0.36%), British West Indian (29.7%, a difference of 1.1%), and Inupiat (29.9%, a difference of 1.5%).
| Demographics | Rating | Rank | No Vehicles in Household |
| Immigrants | Ecuador | 0.0 /100 | #332 | Tragic 23.8% |
| Immigrants | Trinidad and Tobago | 0.0 /100 | #333 | Tragic 24.6% |
| Immigrants | Bangladesh | 0.0 /100 | #334 | Tragic 25.8% |
| Barbadians | 0.0 /100 | #335 | Tragic 26.1% |
| Vietnamese | 0.0 /100 | #336 | Tragic 26.2% |
| Immigrants | Uzbekistan | 0.0 /100 | #337 | Tragic 26.7% |
| Guyanese | 0.0 /100 | #338 | Tragic 29.3% |
| Dominicans | 0.0 /100 | #339 | Tragic 29.4% |
| Immigrants | Barbados | 0.0 /100 | #340 | Tragic 29.5% |
| Immigrants | Guyana | 0.0 /100 | #341 | Tragic 29.5% |
| British West Indians | 0.0 /100 | #342 | Tragic 29.7% |
| Inupiat | 0.0 /100 | #343 | Tragic 29.9% |
| Immigrants | Dominican Republic | 0.0 /100 | #344 | Tragic 31.4% |
| Immigrants | St. Vincent and the Grenadines | 0.0 /100 | #345 | Tragic 35.4% |
| Immigrants | Grenada | 0.0 /100 | #346 | Tragic 37.5% |
Demographics Similar to Navajo by No Vehicles in Household
In terms of no vehicles in household, the demographic groups most similar to Navajo are Serbian (9.4%, a difference of 0.070%), Japanese (9.4%, a difference of 0.070%), Chippewa (9.4%, a difference of 0.24%), Immigrants from Netherlands (9.4%, a difference of 0.49%), and Armenian (9.4%, a difference of 0.59%).
| Demographics | Rating | Rank | No Vehicles in Household |
| Mexican American Indians | 97.6 /100 | #108 | Exceptional 9.1% |
| Maltese | 97.6 /100 | #109 | Exceptional 9.1% |
| Delaware | 97.2 /100 | #110 | Exceptional 9.2% |
| Immigrants | Kuwait | 95.1 /100 | #111 | Exceptional 9.4% |
| Armenians | 95.0 /100 | #112 | Exceptional 9.4% |
| Immigrants | Netherlands | 94.8 /100 | #113 | Exceptional 9.4% |
| Serbians | 94.3 /100 | #114 | Exceptional 9.4% |
| Navajo | 94.2 /100 | #115 | Exceptional 9.4% |
| Japanese | 94.1 /100 | #116 | Exceptional 9.4% |
| Chippewa | 93.8 /100 | #117 | Exceptional 9.4% |
| Greeks | 92.9 /100 | #118 | Exceptional 9.5% |
| Fijians | 92.7 /100 | #119 | Exceptional 9.5% |
| Immigrants | Thailand | 92.6 /100 | #120 | Exceptional 9.5% |
| Puget Sound Salish | 92.4 /100 | #121 | Exceptional 9.5% |
| Costa Ricans | 92.3 /100 | #122 | Exceptional 9.5% |