Danish vs Tlingit-Haida 2 or more Vehicles in Household
COMPARE
Danish
Tlingit-Haida
2 or more Vehicles in Household
2 or more Vehicles in Household Comparison
Danes
Tlingit-Haida
63.3%
2 OR MORE VEHICLES IN HOUSEHOLD
100.0/ 100
METRIC RATING
3rd/ 347
METRIC RANK
55.8%
2 OR MORE VEHICLES IN HOUSEHOLD
68.5/ 100
METRIC RATING
158th/ 347
METRIC RANK
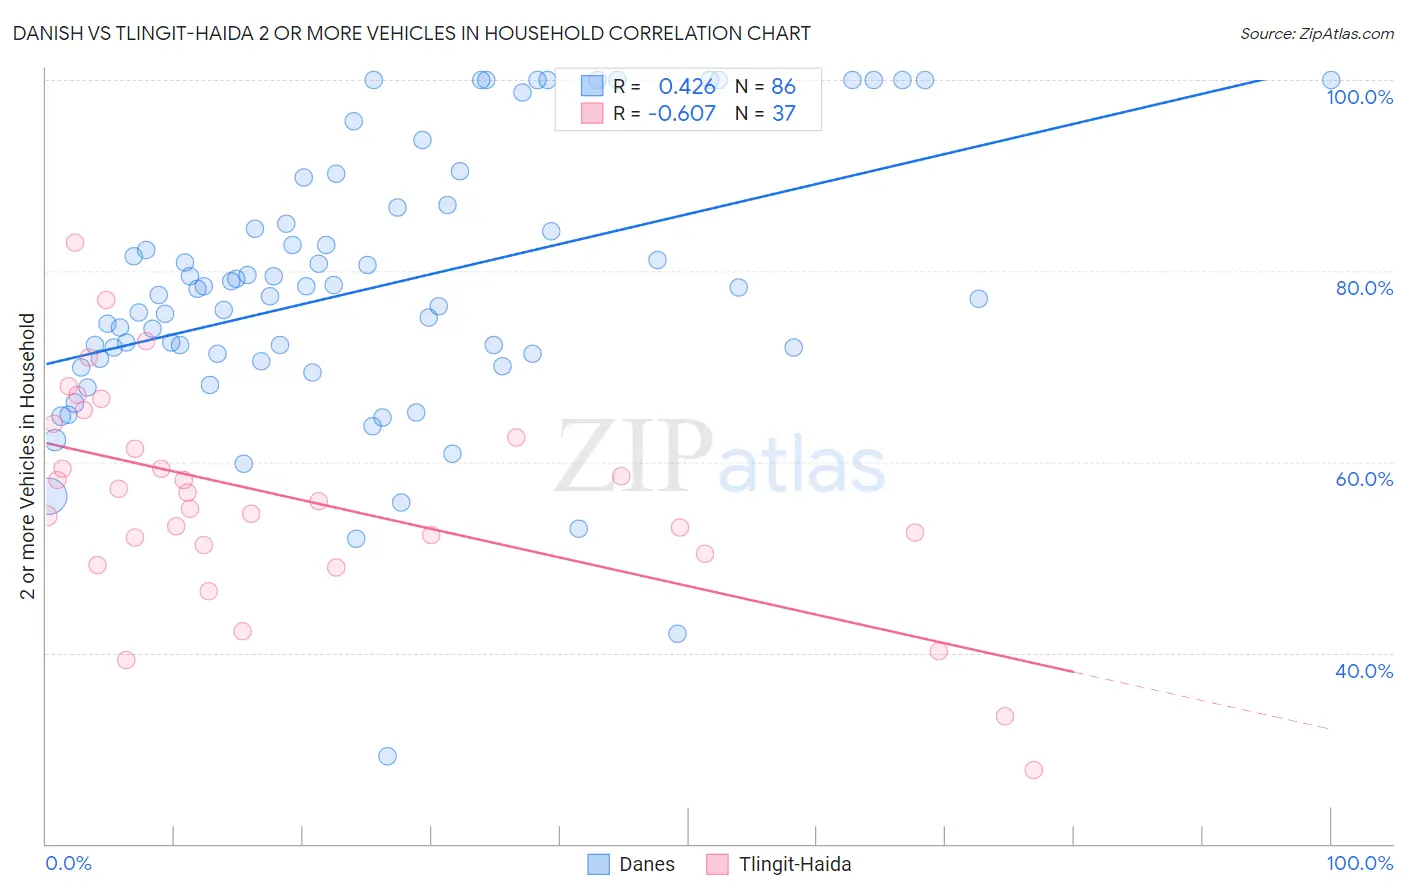
Danish vs Tlingit-Haida 2 or more Vehicles in Household Correlation Chart
The statistical analysis conducted on geographies consisting of 473,941,162 people shows a moderate positive correlation between the proportion of Danes and percentage of households with 2 or more vehicles available in the United States with a correlation coefficient (R) of 0.426 and weighted average of 63.3%. Similarly, the statistical analysis conducted on geographies consisting of 60,853,675 people shows a significant negative correlation between the proportion of Tlingit-Haida and percentage of households with 2 or more vehicles available in the United States with a correlation coefficient (R) of -0.607 and weighted average of 55.8%, a difference of 13.5%.
2 or more Vehicles in Household Correlation Summary
| Measurement | Danish | Tlingit-Haida |
| Minimum | 29.2% | 27.8% |
| Maximum | 100.0% | 83.0% |
| Range | 70.8% | 55.2% |
| Mean | 78.2% | 56.2% |
| Median | 77.8% | 55.8% |
| Interquartile 25% (IQ1) | 70.9% | 50.8% |
| Interquartile 75% (IQ3) | 86.6% | 63.2% |
| Interquartile Range (IQR) | 15.8% | 12.4% |
| Standard Deviation (Sample) | 14.3% | 11.4% |
| Standard Deviation (Population) | 14.2% | 11.2% |
Similar Demographics by 2 or more Vehicles in Household
Demographics Similar to Danes by 2 or more Vehicles in Household
In terms of 2 or more vehicles in household, the demographic groups most similar to Danes are Tongan (63.5%, a difference of 0.37%), Norwegian (62.8%, a difference of 0.69%), Immigrants from Fiji (62.3%, a difference of 1.6%), Scandinavian (62.1%, a difference of 1.9%), and Puget Sound Salish (62.1%, a difference of 2.0%).
| Demographics | Rating | Rank | 2 or more Vehicles in Household |
| Yakama | 100.0 /100 | #1 | Exceptional 64.9% |
| Tongans | 100.0 /100 | #2 | Exceptional 63.5% |
| Danes | 100.0 /100 | #3 | Exceptional 63.3% |
| Norwegians | 100.0 /100 | #4 | Exceptional 62.8% |
| Immigrants | Fiji | 100.0 /100 | #5 | Exceptional 62.3% |
| Scandinavians | 100.0 /100 | #6 | Exceptional 62.1% |
| Puget Sound Salish | 100.0 /100 | #7 | Exceptional 62.1% |
| English | 100.0 /100 | #8 | Exceptional 61.9% |
| Swedes | 100.0 /100 | #9 | Exceptional 61.8% |
| Mexicans | 100.0 /100 | #10 | Exceptional 61.7% |
| Dutch | 100.0 /100 | #11 | Exceptional 61.6% |
| Germans | 100.0 /100 | #12 | Exceptional 61.6% |
| Samoans | 100.0 /100 | #13 | Exceptional 61.5% |
| Czechs | 100.0 /100 | #14 | Exceptional 61.5% |
| Nepalese | 100.0 /100 | #15 | Exceptional 61.4% |
Demographics Similar to Tlingit-Haida by 2 or more Vehicles in Household
In terms of 2 or more vehicles in household, the demographic groups most similar to Tlingit-Haida are Paiute (55.8%, a difference of 0.020%), Crow (55.7%, a difference of 0.070%), Immigrants from Kuwait (55.8%, a difference of 0.080%), Immigrants from Lithuania (55.8%, a difference of 0.090%), and Ukrainian (55.8%, a difference of 0.10%).
| Demographics | Rating | Rank | 2 or more Vehicles in Household |
| Immigrants | Northern Europe | 78.7 /100 | #151 | Good 56.1% |
| Immigrants | Pakistan | 78.1 /100 | #152 | Good 56.1% |
| Lumbee | 71.9 /100 | #153 | Good 55.9% |
| Ukrainians | 70.8 /100 | #154 | Good 55.8% |
| Immigrants | Venezuela | 70.7 /100 | #155 | Good 55.8% |
| Immigrants | Lithuania | 70.4 /100 | #156 | Good 55.8% |
| Immigrants | Kuwait | 70.2 /100 | #157 | Good 55.8% |
| Tlingit-Haida | 68.5 /100 | #158 | Good 55.8% |
| Paiute | 68.0 /100 | #159 | Good 55.8% |
| Crow | 67.0 /100 | #160 | Good 55.7% |
| Colville | 61.1 /100 | #161 | Good 55.6% |
| German Russians | 60.9 /100 | #162 | Good 55.6% |
| Immigrants | Zimbabwe | 60.2 /100 | #163 | Good 55.6% |
| Dutch West Indians | 59.8 /100 | #164 | Average 55.6% |
| Immigrants | El Salvador | 59.4 /100 | #165 | Average 55.6% |