Korean vs Tlingit-Haida 2 or more Vehicles in Household
COMPARE
Korean
Tlingit-Haida
2 or more Vehicles in Household
2 or more Vehicles in Household Comparison
Koreans
Tlingit-Haida
61.0%
2 OR MORE VEHICLES IN HOUSEHOLD
100.0/ 100
METRIC RATING
21st/ 347
METRIC RANK
55.8%
2 OR MORE VEHICLES IN HOUSEHOLD
68.5/ 100
METRIC RATING
158th/ 347
METRIC RANK
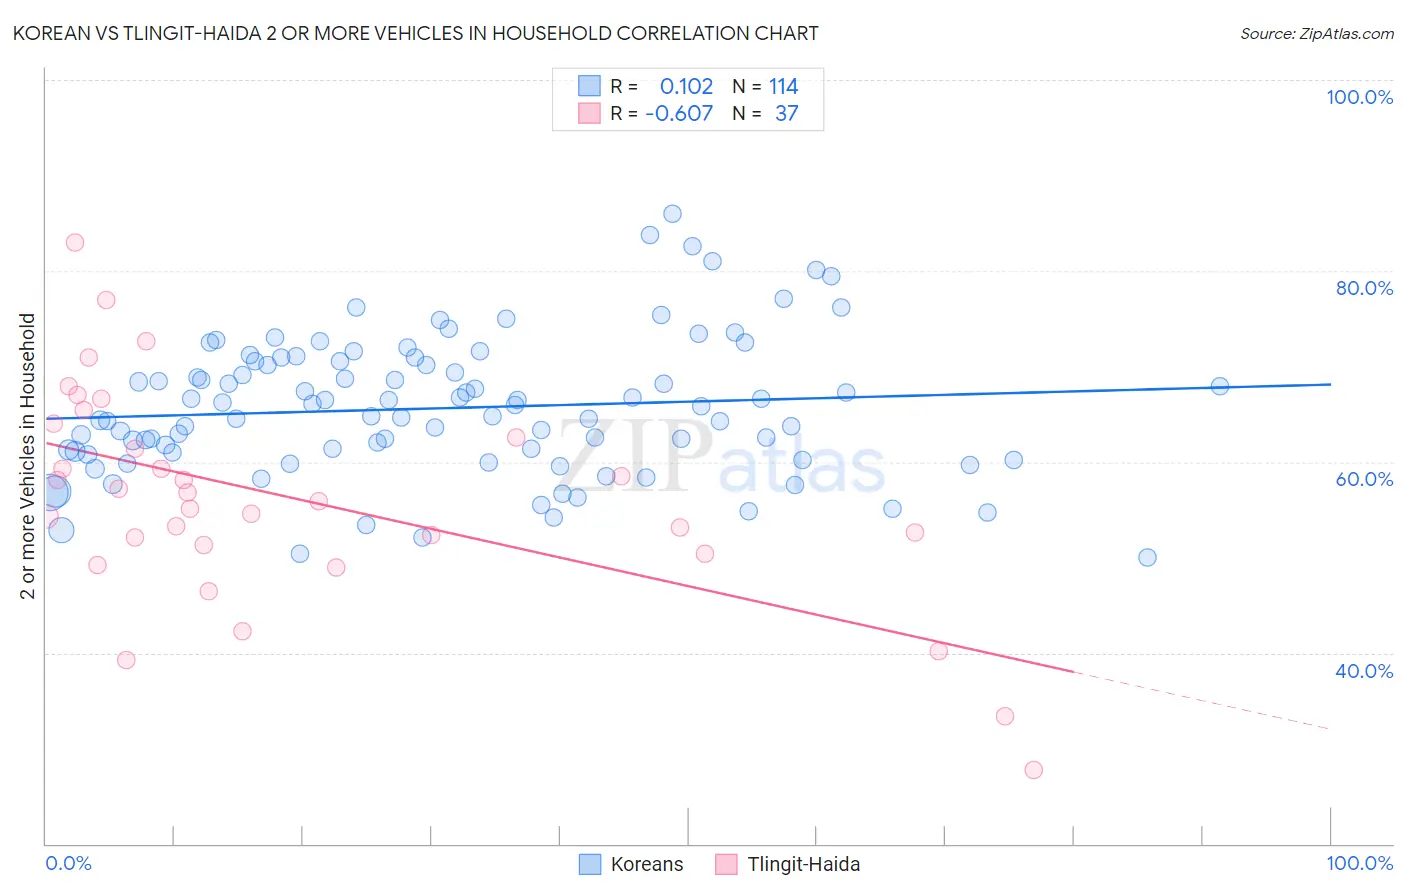
Korean vs Tlingit-Haida 2 or more Vehicles in Household Correlation Chart
The statistical analysis conducted on geographies consisting of 510,458,267 people shows a poor positive correlation between the proportion of Koreans and percentage of households with 2 or more vehicles available in the United States with a correlation coefficient (R) of 0.102 and weighted average of 61.0%. Similarly, the statistical analysis conducted on geographies consisting of 60,853,675 people shows a significant negative correlation between the proportion of Tlingit-Haida and percentage of households with 2 or more vehicles available in the United States with a correlation coefficient (R) of -0.607 and weighted average of 55.8%, a difference of 9.3%.
2 or more Vehicles in Household Correlation Summary
| Measurement | Korean | Tlingit-Haida |
| Minimum | 50.0% | 27.8% |
| Maximum | 86.1% | 83.0% |
| Range | 36.1% | 55.2% |
| Mean | 65.6% | 56.2% |
| Median | 65.3% | 55.8% |
| Interquartile 25% (IQ1) | 61.0% | 50.8% |
| Interquartile 75% (IQ3) | 70.5% | 63.2% |
| Interquartile Range (IQR) | 9.5% | 12.4% |
| Standard Deviation (Sample) | 7.2% | 11.4% |
| Standard Deviation (Population) | 7.2% | 11.2% |
Similar Demographics by 2 or more Vehicles in Household
Demographics Similar to Koreans by 2 or more Vehicles in Household
In terms of 2 or more vehicles in household, the demographic groups most similar to Koreans are Sri Lankan (61.0%, a difference of 0.040%), Swiss (61.0%, a difference of 0.040%), Scotch-Irish (60.9%, a difference of 0.070%), Immigrants from Vietnam (60.9%, a difference of 0.11%), and White/Caucasian (60.8%, a difference of 0.26%).
| Demographics | Rating | Rank | 2 or more Vehicles in Household |
| Czechs | 100.0 /100 | #14 | Exceptional 61.5% |
| Nepalese | 100.0 /100 | #15 | Exceptional 61.4% |
| Native Hawaiians | 100.0 /100 | #16 | Exceptional 61.4% |
| Basques | 100.0 /100 | #17 | Exceptional 61.4% |
| Europeans | 100.0 /100 | #18 | Exceptional 61.4% |
| Scottish | 100.0 /100 | #19 | Exceptional 61.2% |
| Sri Lankans | 100.0 /100 | #20 | Exceptional 61.0% |
| Koreans | 100.0 /100 | #21 | Exceptional 61.0% |
| Swiss | 100.0 /100 | #22 | Exceptional 61.0% |
| Scotch-Irish | 100.0 /100 | #23 | Exceptional 60.9% |
| Immigrants | Vietnam | 100.0 /100 | #24 | Exceptional 60.9% |
| Whites/Caucasians | 100.0 /100 | #25 | Exceptional 60.8% |
| Welsh | 100.0 /100 | #26 | Exceptional 60.8% |
| Assyrians/Chaldeans/Syriacs | 100.0 /100 | #27 | Exceptional 60.5% |
| Guamanians/Chamorros | 100.0 /100 | #28 | Exceptional 60.5% |
Demographics Similar to Tlingit-Haida by 2 or more Vehicles in Household
In terms of 2 or more vehicles in household, the demographic groups most similar to Tlingit-Haida are Paiute (55.8%, a difference of 0.020%), Crow (55.7%, a difference of 0.070%), Immigrants from Kuwait (55.8%, a difference of 0.080%), Immigrants from Lithuania (55.8%, a difference of 0.090%), and Ukrainian (55.8%, a difference of 0.10%).
| Demographics | Rating | Rank | 2 or more Vehicles in Household |
| Immigrants | Northern Europe | 78.7 /100 | #151 | Good 56.1% |
| Immigrants | Pakistan | 78.1 /100 | #152 | Good 56.1% |
| Lumbee | 71.9 /100 | #153 | Good 55.9% |
| Ukrainians | 70.8 /100 | #154 | Good 55.8% |
| Immigrants | Venezuela | 70.7 /100 | #155 | Good 55.8% |
| Immigrants | Lithuania | 70.4 /100 | #156 | Good 55.8% |
| Immigrants | Kuwait | 70.2 /100 | #157 | Good 55.8% |
| Tlingit-Haida | 68.5 /100 | #158 | Good 55.8% |
| Paiute | 68.0 /100 | #159 | Good 55.8% |
| Crow | 67.0 /100 | #160 | Good 55.7% |
| Colville | 61.1 /100 | #161 | Good 55.6% |
| German Russians | 60.9 /100 | #162 | Good 55.6% |
| Immigrants | Zimbabwe | 60.2 /100 | #163 | Good 55.6% |
| Dutch West Indians | 59.8 /100 | #164 | Average 55.6% |
| Immigrants | El Salvador | 59.4 /100 | #165 | Average 55.6% |