Danish vs Immigrants from Vietnam 2 or more Vehicles in Household
COMPARE
Danish
Immigrants from Vietnam
2 or more Vehicles in Household
2 or more Vehicles in Household Comparison
Danes
Immigrants from Vietnam
63.3%
2 OR MORE VEHICLES IN HOUSEHOLD
100.0/ 100
METRIC RATING
3rd/ 347
METRIC RANK
60.9%
2 OR MORE VEHICLES IN HOUSEHOLD
100.0/ 100
METRIC RATING
24th/ 347
METRIC RANK
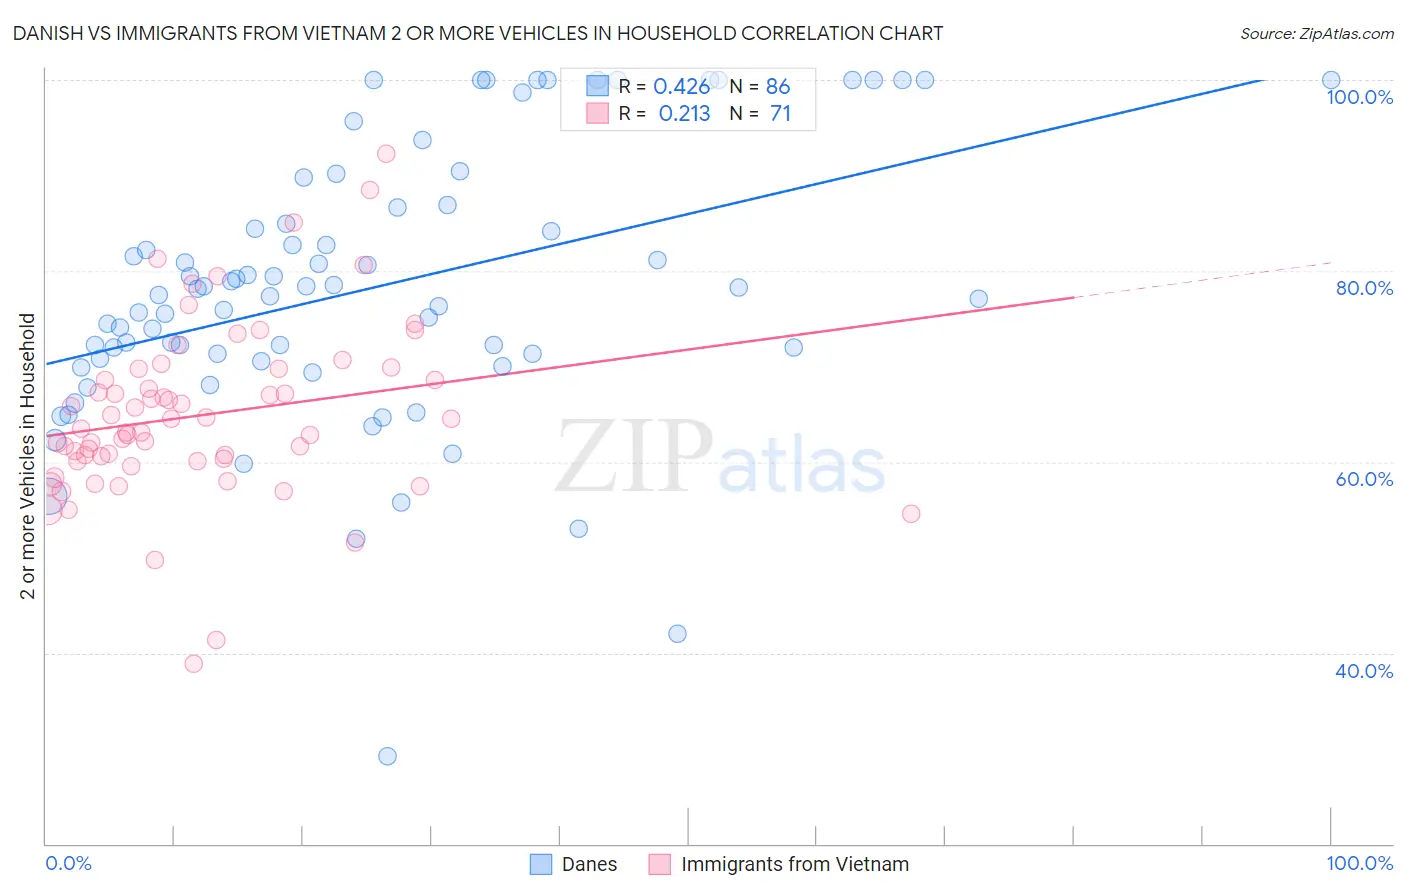
Danish vs Immigrants from Vietnam 2 or more Vehicles in Household Correlation Chart
The statistical analysis conducted on geographies consisting of 473,941,162 people shows a moderate positive correlation between the proportion of Danes and percentage of households with 2 or more vehicles available in the United States with a correlation coefficient (R) of 0.426 and weighted average of 63.3%. Similarly, the statistical analysis conducted on geographies consisting of 404,606,887 people shows a weak positive correlation between the proportion of Immigrants from Vietnam and percentage of households with 2 or more vehicles available in the United States with a correlation coefficient (R) of 0.213 and weighted average of 60.9%, a difference of 3.9%.
2 or more Vehicles in Household Correlation Summary
| Measurement | Danish | Immigrants from Vietnam |
| Minimum | 29.2% | 38.9% |
| Maximum | 100.0% | 92.3% |
| Range | 70.8% | 53.4% |
| Mean | 78.2% | 64.9% |
| Median | 77.8% | 63.5% |
| Interquartile 25% (IQ1) | 70.9% | 60.1% |
| Interquartile 75% (IQ3) | 86.6% | 69.7% |
| Interquartile Range (IQR) | 15.8% | 9.7% |
| Standard Deviation (Sample) | 14.3% | 9.2% |
| Standard Deviation (Population) | 14.2% | 9.2% |
Similar Demographics by 2 or more Vehicles in Household
Demographics Similar to Danes by 2 or more Vehicles in Household
In terms of 2 or more vehicles in household, the demographic groups most similar to Danes are Tongan (63.5%, a difference of 0.37%), Norwegian (62.8%, a difference of 0.69%), Immigrants from Fiji (62.3%, a difference of 1.6%), Scandinavian (62.1%, a difference of 1.9%), and Puget Sound Salish (62.1%, a difference of 2.0%).
| Demographics | Rating | Rank | 2 or more Vehicles in Household |
| Yakama | 100.0 /100 | #1 | Exceptional 64.9% |
| Tongans | 100.0 /100 | #2 | Exceptional 63.5% |
| Danes | 100.0 /100 | #3 | Exceptional 63.3% |
| Norwegians | 100.0 /100 | #4 | Exceptional 62.8% |
| Immigrants | Fiji | 100.0 /100 | #5 | Exceptional 62.3% |
| Scandinavians | 100.0 /100 | #6 | Exceptional 62.1% |
| Puget Sound Salish | 100.0 /100 | #7 | Exceptional 62.1% |
| English | 100.0 /100 | #8 | Exceptional 61.9% |
| Swedes | 100.0 /100 | #9 | Exceptional 61.8% |
| Mexicans | 100.0 /100 | #10 | Exceptional 61.7% |
| Dutch | 100.0 /100 | #11 | Exceptional 61.6% |
| Germans | 100.0 /100 | #12 | Exceptional 61.6% |
| Samoans | 100.0 /100 | #13 | Exceptional 61.5% |
| Czechs | 100.0 /100 | #14 | Exceptional 61.5% |
| Nepalese | 100.0 /100 | #15 | Exceptional 61.4% |
Demographics Similar to Immigrants from Vietnam by 2 or more Vehicles in Household
In terms of 2 or more vehicles in household, the demographic groups most similar to Immigrants from Vietnam are Scotch-Irish (60.9%, a difference of 0.040%), Swiss (61.0%, a difference of 0.070%), Korean (61.0%, a difference of 0.11%), White/Caucasian (60.8%, a difference of 0.15%), and Sri Lankan (61.0%, a difference of 0.16%).
| Demographics | Rating | Rank | 2 or more Vehicles in Household |
| Basques | 100.0 /100 | #17 | Exceptional 61.4% |
| Europeans | 100.0 /100 | #18 | Exceptional 61.4% |
| Scottish | 100.0 /100 | #19 | Exceptional 61.2% |
| Sri Lankans | 100.0 /100 | #20 | Exceptional 61.0% |
| Koreans | 100.0 /100 | #21 | Exceptional 61.0% |
| Swiss | 100.0 /100 | #22 | Exceptional 61.0% |
| Scotch-Irish | 100.0 /100 | #23 | Exceptional 60.9% |
| Immigrants | Vietnam | 100.0 /100 | #24 | Exceptional 60.9% |
| Whites/Caucasians | 100.0 /100 | #25 | Exceptional 60.8% |
| Welsh | 100.0 /100 | #26 | Exceptional 60.8% |
| Assyrians/Chaldeans/Syriacs | 100.0 /100 | #27 | Exceptional 60.5% |
| Guamanians/Chamorros | 100.0 /100 | #28 | Exceptional 60.5% |
| Hawaiians | 100.0 /100 | #29 | Exceptional 60.4% |
| Finns | 100.0 /100 | #30 | Exceptional 60.3% |
| Spanish American Indians | 100.0 /100 | #31 | Exceptional 60.3% |