Czechoslovakian vs Immigrants from Israel 2 or more Vehicles in Household
COMPARE
Czechoslovakian
Immigrants from Israel
2 or more Vehicles in Household
2 or more Vehicles in Household Comparison
Czechoslovakians
Immigrants from Israel
59.8%
2 OR MORE VEHICLES IN HOUSEHOLD
100.0/ 100
METRIC RATING
43rd/ 347
METRIC RANK
49.2%
2 OR MORE VEHICLES IN HOUSEHOLD
0.0/ 100
METRIC RATING
306th/ 347
METRIC RANK
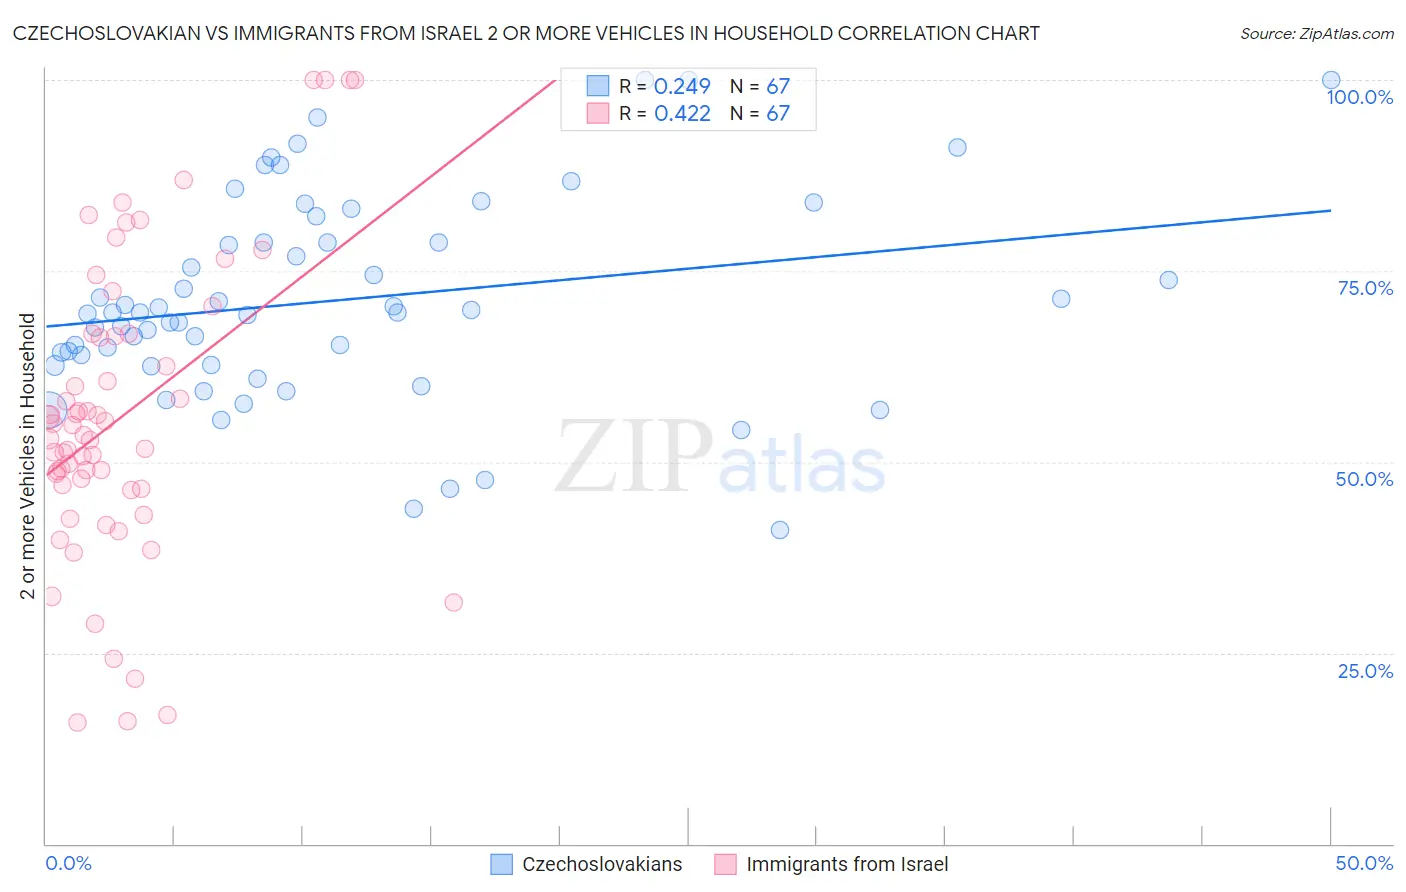
Czechoslovakian vs Immigrants from Israel 2 or more Vehicles in Household Correlation Chart
The statistical analysis conducted on geographies consisting of 368,548,443 people shows a weak positive correlation between the proportion of Czechoslovakians and percentage of households with 2 or more vehicles available in the United States with a correlation coefficient (R) of 0.249 and weighted average of 59.8%. Similarly, the statistical analysis conducted on geographies consisting of 209,979,242 people shows a moderate positive correlation between the proportion of Immigrants from Israel and percentage of households with 2 or more vehicles available in the United States with a correlation coefficient (R) of 0.422 and weighted average of 49.2%, a difference of 21.5%.
2 or more Vehicles in Household Correlation Summary
| Measurement | Czechoslovakian | Immigrants from Israel |
| Minimum | 41.1% | 15.9% |
| Maximum | 100.0% | 100.0% |
| Range | 58.9% | 84.1% |
| Mean | 71.2% | 56.1% |
| Median | 69.5% | 53.6% |
| Interquartile 25% (IQ1) | 62.6% | 46.4% |
| Interquartile 75% (IQ3) | 78.8% | 66.7% |
| Interquartile Range (IQR) | 16.2% | 20.3% |
| Standard Deviation (Sample) | 13.2% | 19.7% |
| Standard Deviation (Population) | 13.1% | 19.5% |
Similar Demographics by 2 or more Vehicles in Household
Demographics Similar to Czechoslovakians by 2 or more Vehicles in Household
In terms of 2 or more vehicles in household, the demographic groups most similar to Czechoslovakians are French (59.8%, a difference of 0.060%), Malaysian (59.8%, a difference of 0.080%), Northern European (59.9%, a difference of 0.090%), Immigrants from Taiwan (59.7%, a difference of 0.10%), and Cherokee (59.9%, a difference of 0.11%).
| Demographics | Rating | Rank | 2 or more Vehicles in Household |
| Chinese | 100.0 /100 | #36 | Exceptional 60.1% |
| Irish | 100.0 /100 | #37 | Exceptional 60.1% |
| Americans | 100.0 /100 | #38 | Exceptional 60.0% |
| British | 100.0 /100 | #39 | Exceptional 60.0% |
| Cherokee | 100.0 /100 | #40 | Exceptional 59.9% |
| Northern Europeans | 100.0 /100 | #41 | Exceptional 59.9% |
| Malaysians | 100.0 /100 | #42 | Exceptional 59.8% |
| Czechoslovakians | 100.0 /100 | #43 | Exceptional 59.8% |
| French | 100.0 /100 | #44 | Exceptional 59.8% |
| Immigrants | Taiwan | 100.0 /100 | #45 | Exceptional 59.7% |
| Immigrants | South Eastern Asia | 100.0 /100 | #46 | Exceptional 59.6% |
| Yaqui | 99.9 /100 | #47 | Exceptional 59.3% |
| Immigrants | India | 99.9 /100 | #48 | Exceptional 59.3% |
| Belgians | 99.9 /100 | #49 | Exceptional 59.3% |
| Choctaw | 99.9 /100 | #50 | Exceptional 59.3% |
Demographics Similar to Immigrants from Israel by 2 or more Vehicles in Household
In terms of 2 or more vehicles in household, the demographic groups most similar to Immigrants from Israel are Immigrants from Western Africa (49.4%, a difference of 0.26%), Hopi (49.0%, a difference of 0.43%), Albanian (49.0%, a difference of 0.50%), Moroccan (48.8%, a difference of 0.85%), and Immigrants from Belize (49.9%, a difference of 1.3%).
| Demographics | Rating | Rank | 2 or more Vehicles in Household |
| Immigrants | Morocco | 0.0 /100 | #299 | Tragic 50.3% |
| Immigrants | Russia | 0.0 /100 | #300 | Tragic 50.3% |
| Immigrants | Greece | 0.0 /100 | #301 | Tragic 50.2% |
| Immigrants | South America | 0.0 /100 | #302 | Tragic 50.2% |
| Tohono O'odham | 0.0 /100 | #303 | Tragic 50.0% |
| Immigrants | Belize | 0.0 /100 | #304 | Tragic 49.9% |
| Immigrants | Western Africa | 0.0 /100 | #305 | Tragic 49.4% |
| Immigrants | Israel | 0.0 /100 | #306 | Tragic 49.2% |
| Hopi | 0.0 /100 | #307 | Tragic 49.0% |
| Albanians | 0.0 /100 | #308 | Tragic 49.0% |
| Moroccans | 0.0 /100 | #309 | Tragic 48.8% |
| Ghanaians | 0.0 /100 | #310 | Tragic 48.0% |
| Immigrants | Belarus | 0.0 /100 | #311 | Tragic 47.9% |
| Haitians | 0.0 /100 | #312 | Tragic 47.6% |
| U.S. Virgin Islanders | 0.0 /100 | #313 | Tragic 47.5% |