Czechoslovakian vs Immigrants from Armenia 2 or more Vehicles in Household
COMPARE
Czechoslovakian
Immigrants from Armenia
2 or more Vehicles in Household
2 or more Vehicles in Household Comparison
Czechoslovakians
Immigrants from Armenia
59.8%
2 OR MORE VEHICLES IN HOUSEHOLD
100.0/ 100
METRIC RATING
43rd/ 347
METRIC RANK
53.3%
2 OR MORE VEHICLES IN HOUSEHOLD
2.3/ 100
METRIC RATING
238th/ 347
METRIC RANK
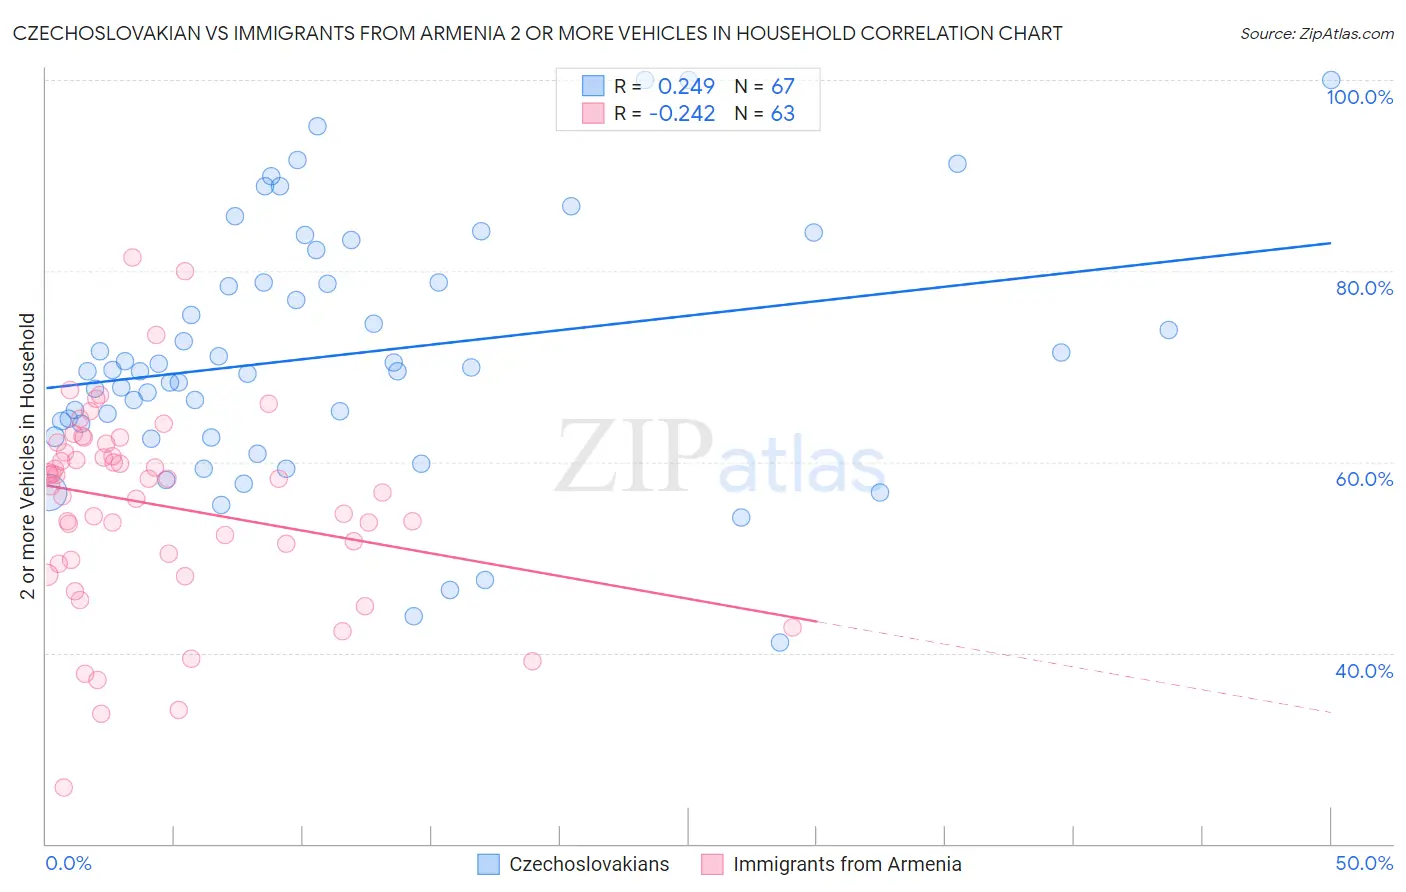
Czechoslovakian vs Immigrants from Armenia 2 or more Vehicles in Household Correlation Chart
The statistical analysis conducted on geographies consisting of 368,548,443 people shows a weak positive correlation between the proportion of Czechoslovakians and percentage of households with 2 or more vehicles available in the United States with a correlation coefficient (R) of 0.249 and weighted average of 59.8%. Similarly, the statistical analysis conducted on geographies consisting of 97,683,198 people shows a weak negative correlation between the proportion of Immigrants from Armenia and percentage of households with 2 or more vehicles available in the United States with a correlation coefficient (R) of -0.242 and weighted average of 53.3%, a difference of 12.2%.
2 or more Vehicles in Household Correlation Summary
| Measurement | Czechoslovakian | Immigrants from Armenia |
| Minimum | 41.1% | 25.8% |
| Maximum | 100.0% | 81.4% |
| Range | 58.9% | 55.6% |
| Mean | 71.2% | 55.5% |
| Median | 69.5% | 58.2% |
| Interquartile 25% (IQ1) | 62.6% | 49.7% |
| Interquartile 75% (IQ3) | 78.8% | 61.9% |
| Interquartile Range (IQR) | 16.2% | 12.2% |
| Standard Deviation (Sample) | 13.2% | 10.5% |
| Standard Deviation (Population) | 13.1% | 10.4% |
Similar Demographics by 2 or more Vehicles in Household
Demographics Similar to Czechoslovakians by 2 or more Vehicles in Household
In terms of 2 or more vehicles in household, the demographic groups most similar to Czechoslovakians are French (59.8%, a difference of 0.060%), Malaysian (59.8%, a difference of 0.080%), Northern European (59.9%, a difference of 0.090%), Immigrants from Taiwan (59.7%, a difference of 0.10%), and Cherokee (59.9%, a difference of 0.11%).
| Demographics | Rating | Rank | 2 or more Vehicles in Household |
| Chinese | 100.0 /100 | #36 | Exceptional 60.1% |
| Irish | 100.0 /100 | #37 | Exceptional 60.1% |
| Americans | 100.0 /100 | #38 | Exceptional 60.0% |
| British | 100.0 /100 | #39 | Exceptional 60.0% |
| Cherokee | 100.0 /100 | #40 | Exceptional 59.9% |
| Northern Europeans | 100.0 /100 | #41 | Exceptional 59.9% |
| Malaysians | 100.0 /100 | #42 | Exceptional 59.8% |
| Czechoslovakians | 100.0 /100 | #43 | Exceptional 59.8% |
| French | 100.0 /100 | #44 | Exceptional 59.8% |
| Immigrants | Taiwan | 100.0 /100 | #45 | Exceptional 59.7% |
| Immigrants | South Eastern Asia | 100.0 /100 | #46 | Exceptional 59.6% |
| Yaqui | 99.9 /100 | #47 | Exceptional 59.3% |
| Immigrants | India | 99.9 /100 | #48 | Exceptional 59.3% |
| Belgians | 99.9 /100 | #49 | Exceptional 59.3% |
| Choctaw | 99.9 /100 | #50 | Exceptional 59.3% |
Demographics Similar to Immigrants from Armenia by 2 or more Vehicles in Household
In terms of 2 or more vehicles in household, the demographic groups most similar to Immigrants from Armenia are Cambodian (53.3%, a difference of 0.010%), Macedonian (53.3%, a difference of 0.070%), Immigrants from Europe (53.2%, a difference of 0.070%), Immigrants from Sierra Leone (53.2%, a difference of 0.10%), and Immigrants from Eastern Asia (53.2%, a difference of 0.11%).
| Demographics | Rating | Rank | 2 or more Vehicles in Household |
| Panamanians | 3.4 /100 | #231 | Tragic 53.5% |
| Immigrants | Guatemala | 3.2 /100 | #232 | Tragic 53.5% |
| Ugandans | 3.2 /100 | #233 | Tragic 53.5% |
| Immigrants | Switzerland | 3.0 /100 | #234 | Tragic 53.4% |
| Immigrants | Middle Africa | 3.0 /100 | #235 | Tragic 53.4% |
| Indonesians | 2.7 /100 | #236 | Tragic 53.4% |
| Macedonians | 2.4 /100 | #237 | Tragic 53.3% |
| Immigrants | Armenia | 2.3 /100 | #238 | Tragic 53.3% |
| Cambodians | 2.3 /100 | #239 | Tragic 53.3% |
| Immigrants | Europe | 2.1 /100 | #240 | Tragic 53.2% |
| Immigrants | Sierra Leone | 2.1 /100 | #241 | Tragic 53.2% |
| Immigrants | Eastern Asia | 2.1 /100 | #242 | Tragic 53.2% |
| Ethiopians | 1.7 /100 | #243 | Tragic 53.1% |
| Indians (Asian) | 1.7 /100 | #244 | Tragic 53.1% |
| Immigrants | Ethiopia | 1.5 /100 | #245 | Tragic 53.0% |