Korean vs Immigrants from Israel 2 or more Vehicles in Household
COMPARE
Korean
Immigrants from Israel
2 or more Vehicles in Household
2 or more Vehicles in Household Comparison
Koreans
Immigrants from Israel
61.0%
2 OR MORE VEHICLES IN HOUSEHOLD
100.0/ 100
METRIC RATING
21st/ 347
METRIC RANK
49.2%
2 OR MORE VEHICLES IN HOUSEHOLD
0.0/ 100
METRIC RATING
306th/ 347
METRIC RANK
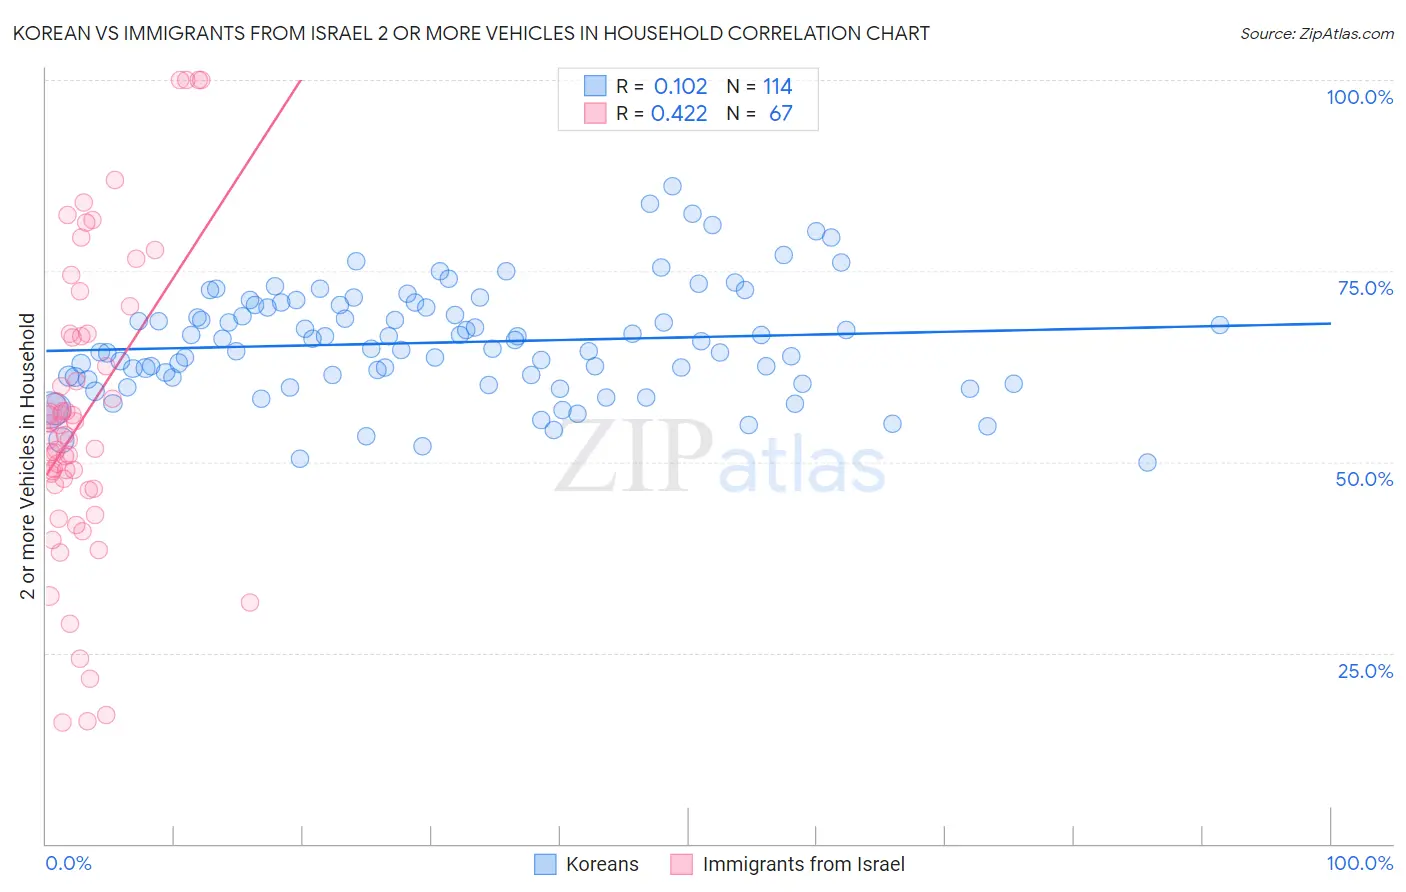
Korean vs Immigrants from Israel 2 or more Vehicles in Household Correlation Chart
The statistical analysis conducted on geographies consisting of 510,458,267 people shows a poor positive correlation between the proportion of Koreans and percentage of households with 2 or more vehicles available in the United States with a correlation coefficient (R) of 0.102 and weighted average of 61.0%. Similarly, the statistical analysis conducted on geographies consisting of 209,979,242 people shows a moderate positive correlation between the proportion of Immigrants from Israel and percentage of households with 2 or more vehicles available in the United States with a correlation coefficient (R) of 0.422 and weighted average of 49.2%, a difference of 23.9%.
2 or more Vehicles in Household Correlation Summary
| Measurement | Korean | Immigrants from Israel |
| Minimum | 50.0% | 15.9% |
| Maximum | 86.1% | 100.0% |
| Range | 36.1% | 84.1% |
| Mean | 65.6% | 56.1% |
| Median | 65.3% | 53.6% |
| Interquartile 25% (IQ1) | 61.0% | 46.4% |
| Interquartile 75% (IQ3) | 70.5% | 66.7% |
| Interquartile Range (IQR) | 9.5% | 20.3% |
| Standard Deviation (Sample) | 7.2% | 19.7% |
| Standard Deviation (Population) | 7.2% | 19.5% |
Similar Demographics by 2 or more Vehicles in Household
Demographics Similar to Koreans by 2 or more Vehicles in Household
In terms of 2 or more vehicles in household, the demographic groups most similar to Koreans are Sri Lankan (61.0%, a difference of 0.040%), Swiss (61.0%, a difference of 0.040%), Scotch-Irish (60.9%, a difference of 0.070%), Immigrants from Vietnam (60.9%, a difference of 0.11%), and White/Caucasian (60.8%, a difference of 0.26%).
| Demographics | Rating | Rank | 2 or more Vehicles in Household |
| Czechs | 100.0 /100 | #14 | Exceptional 61.5% |
| Nepalese | 100.0 /100 | #15 | Exceptional 61.4% |
| Native Hawaiians | 100.0 /100 | #16 | Exceptional 61.4% |
| Basques | 100.0 /100 | #17 | Exceptional 61.4% |
| Europeans | 100.0 /100 | #18 | Exceptional 61.4% |
| Scottish | 100.0 /100 | #19 | Exceptional 61.2% |
| Sri Lankans | 100.0 /100 | #20 | Exceptional 61.0% |
| Koreans | 100.0 /100 | #21 | Exceptional 61.0% |
| Swiss | 100.0 /100 | #22 | Exceptional 61.0% |
| Scotch-Irish | 100.0 /100 | #23 | Exceptional 60.9% |
| Immigrants | Vietnam | 100.0 /100 | #24 | Exceptional 60.9% |
| Whites/Caucasians | 100.0 /100 | #25 | Exceptional 60.8% |
| Welsh | 100.0 /100 | #26 | Exceptional 60.8% |
| Assyrians/Chaldeans/Syriacs | 100.0 /100 | #27 | Exceptional 60.5% |
| Guamanians/Chamorros | 100.0 /100 | #28 | Exceptional 60.5% |
Demographics Similar to Immigrants from Israel by 2 or more Vehicles in Household
In terms of 2 or more vehicles in household, the demographic groups most similar to Immigrants from Israel are Immigrants from Western Africa (49.4%, a difference of 0.26%), Hopi (49.0%, a difference of 0.43%), Albanian (49.0%, a difference of 0.50%), Moroccan (48.8%, a difference of 0.85%), and Immigrants from Belize (49.9%, a difference of 1.3%).
| Demographics | Rating | Rank | 2 or more Vehicles in Household |
| Immigrants | Morocco | 0.0 /100 | #299 | Tragic 50.3% |
| Immigrants | Russia | 0.0 /100 | #300 | Tragic 50.3% |
| Immigrants | Greece | 0.0 /100 | #301 | Tragic 50.2% |
| Immigrants | South America | 0.0 /100 | #302 | Tragic 50.2% |
| Tohono O'odham | 0.0 /100 | #303 | Tragic 50.0% |
| Immigrants | Belize | 0.0 /100 | #304 | Tragic 49.9% |
| Immigrants | Western Africa | 0.0 /100 | #305 | Tragic 49.4% |
| Immigrants | Israel | 0.0 /100 | #306 | Tragic 49.2% |
| Hopi | 0.0 /100 | #307 | Tragic 49.0% |
| Albanians | 0.0 /100 | #308 | Tragic 49.0% |
| Moroccans | 0.0 /100 | #309 | Tragic 48.8% |
| Ghanaians | 0.0 /100 | #310 | Tragic 48.0% |
| Immigrants | Belarus | 0.0 /100 | #311 | Tragic 47.9% |
| Haitians | 0.0 /100 | #312 | Tragic 47.6% |
| U.S. Virgin Islanders | 0.0 /100 | #313 | Tragic 47.5% |