Czechoslovakian vs Immigrants from Israel In Labor Force | Age 16-19
COMPARE
Czechoslovakian
Immigrants from Israel
In Labor Force | Age 16-19
In Labor Force | Age 16-19 Comparison
Czechoslovakians
Immigrants from Israel
41.9%
IN LABOR FORCE | AGE 16-19
100.0/ 100
METRIC RATING
32nd/ 347
METRIC RANK
30.5%
IN LABOR FORCE | AGE 16-19
0.0/ 100
METRIC RATING
332nd/ 347
METRIC RANK
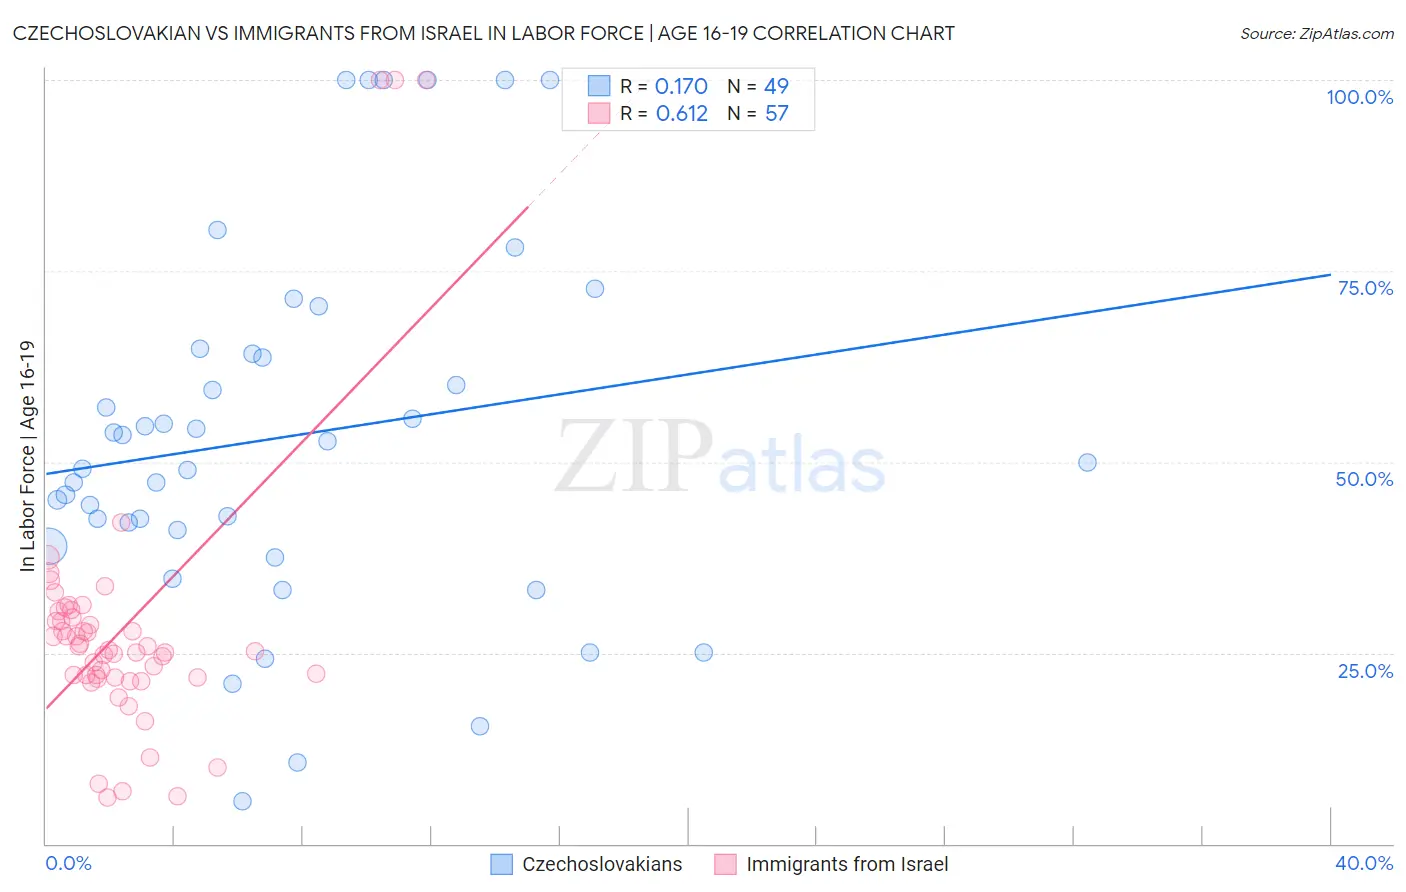
Czechoslovakian vs Immigrants from Israel In Labor Force | Age 16-19 Correlation Chart
The statistical analysis conducted on geographies consisting of 368,118,487 people shows a poor positive correlation between the proportion of Czechoslovakians and labor force participation rate among population between the ages 16 and 19 in the United States with a correlation coefficient (R) of 0.170 and weighted average of 41.9%. Similarly, the statistical analysis conducted on geographies consisting of 209,706,928 people shows a significant positive correlation between the proportion of Immigrants from Israel and labor force participation rate among population between the ages 16 and 19 in the United States with a correlation coefficient (R) of 0.612 and weighted average of 30.5%, a difference of 37.4%.
In Labor Force | Age 16-19 Correlation Summary
| Measurement | Czechoslovakian | Immigrants from Israel |
| Minimum | 5.6% | 6.1% |
| Maximum | 100.0% | 100.0% |
| Range | 94.4% | 93.9% |
| Mean | 53.4% | 28.4% |
| Median | 50.0% | 25.4% |
| Interquartile 25% (IQ1) | 40.0% | 21.8% |
| Interquartile 75% (IQ3) | 64.5% | 30.0% |
| Interquartile Range (IQR) | 24.5% | 8.2% |
| Standard Deviation (Sample) | 23.9% | 18.6% |
| Standard Deviation (Population) | 23.7% | 18.4% |
Similar Demographics by In Labor Force | Age 16-19
Demographics Similar to Czechoslovakians by In Labor Force | Age 16-19
In terms of in labor force | age 16-19, the demographic groups most similar to Czechoslovakians are Liberian (41.8%, a difference of 0.14%), Irish (42.0%, a difference of 0.20%), Immigrants from Bosnia and Herzegovina (41.8%, a difference of 0.22%), Yugoslavian (41.8%, a difference of 0.24%), and Scottish (42.0%, a difference of 0.27%).
| Demographics | Rating | Rank | In Labor Force | Age 16-19 |
| German Russians | 100.0 /100 | #25 | Exceptional 42.4% |
| English | 100.0 /100 | #26 | Exceptional 42.4% |
| Welsh | 100.0 /100 | #27 | Exceptional 42.3% |
| Poles | 100.0 /100 | #28 | Exceptional 42.1% |
| French | 100.0 /100 | #29 | Exceptional 42.1% |
| Scottish | 100.0 /100 | #30 | Exceptional 42.0% |
| Irish | 100.0 /100 | #31 | Exceptional 42.0% |
| Czechoslovakians | 100.0 /100 | #32 | Exceptional 41.9% |
| Liberians | 100.0 /100 | #33 | Exceptional 41.8% |
| Immigrants | Bosnia and Herzegovina | 100.0 /100 | #34 | Exceptional 41.8% |
| Yugoslavians | 100.0 /100 | #35 | Exceptional 41.8% |
| Immigrants | Azores | 100.0 /100 | #36 | Exceptional 41.7% |
| Immigrants | Congo | 100.0 /100 | #37 | Exceptional 41.7% |
| Sioux | 100.0 /100 | #38 | Exceptional 41.5% |
| Scotch-Irish | 100.0 /100 | #39 | Exceptional 41.5% |
Demographics Similar to Immigrants from Israel by In Labor Force | Age 16-19
In terms of in labor force | age 16-19, the demographic groups most similar to Immigrants from Israel are Immigrants from Hong Kong (30.5%, a difference of 0.020%), Puerto Rican (30.3%, a difference of 0.44%), Immigrants from Cuba (30.2%, a difference of 0.77%), Immigrants from Trinidad and Tobago (30.2%, a difference of 1.1%), and Immigrants from Bangladesh (30.0%, a difference of 1.4%).
| Demographics | Rating | Rank | In Labor Force | Age 16-19 |
| Immigrants | China | 0.0 /100 | #325 | Tragic 31.1% |
| Immigrants | Dominican Republic | 0.0 /100 | #326 | Tragic 31.1% |
| Immigrants | Taiwan | 0.0 /100 | #327 | Tragic 31.0% |
| Immigrants | Ecuador | 0.0 /100 | #328 | Tragic 31.0% |
| Barbadians | 0.0 /100 | #329 | Tragic 31.0% |
| Lumbee | 0.0 /100 | #330 | Tragic 31.0% |
| Trinidadians and Tobagonians | 0.0 /100 | #331 | Tragic 30.9% |
| Immigrants | Israel | 0.0 /100 | #332 | Tragic 30.5% |
| Immigrants | Hong Kong | 0.0 /100 | #333 | Tragic 30.5% |
| Puerto Ricans | 0.0 /100 | #334 | Tragic 30.3% |
| Immigrants | Cuba | 0.0 /100 | #335 | Tragic 30.2% |
| Immigrants | Trinidad and Tobago | 0.0 /100 | #336 | Tragic 30.2% |
| Immigrants | Bangladesh | 0.0 /100 | #337 | Tragic 30.0% |
| Vietnamese | 0.0 /100 | #338 | Tragic 29.6% |
| Immigrants | Uzbekistan | 0.0 /100 | #339 | Tragic 29.2% |