Comanche vs Irish 4 or more Vehicles in Household
COMPARE
Comanche
Irish
4 or more Vehicles in Household
4 or more Vehicles in Household Comparison
Comanche
Irish
6.8%
4 OR MORE VEHICLES IN HOUSEHOLD
94.8/ 100
METRIC RATING
120th/ 347
METRIC RANK
7.1%
4 OR MORE VEHICLES IN HOUSEHOLD
99.0/ 100
METRIC RATING
98th/ 347
METRIC RANK
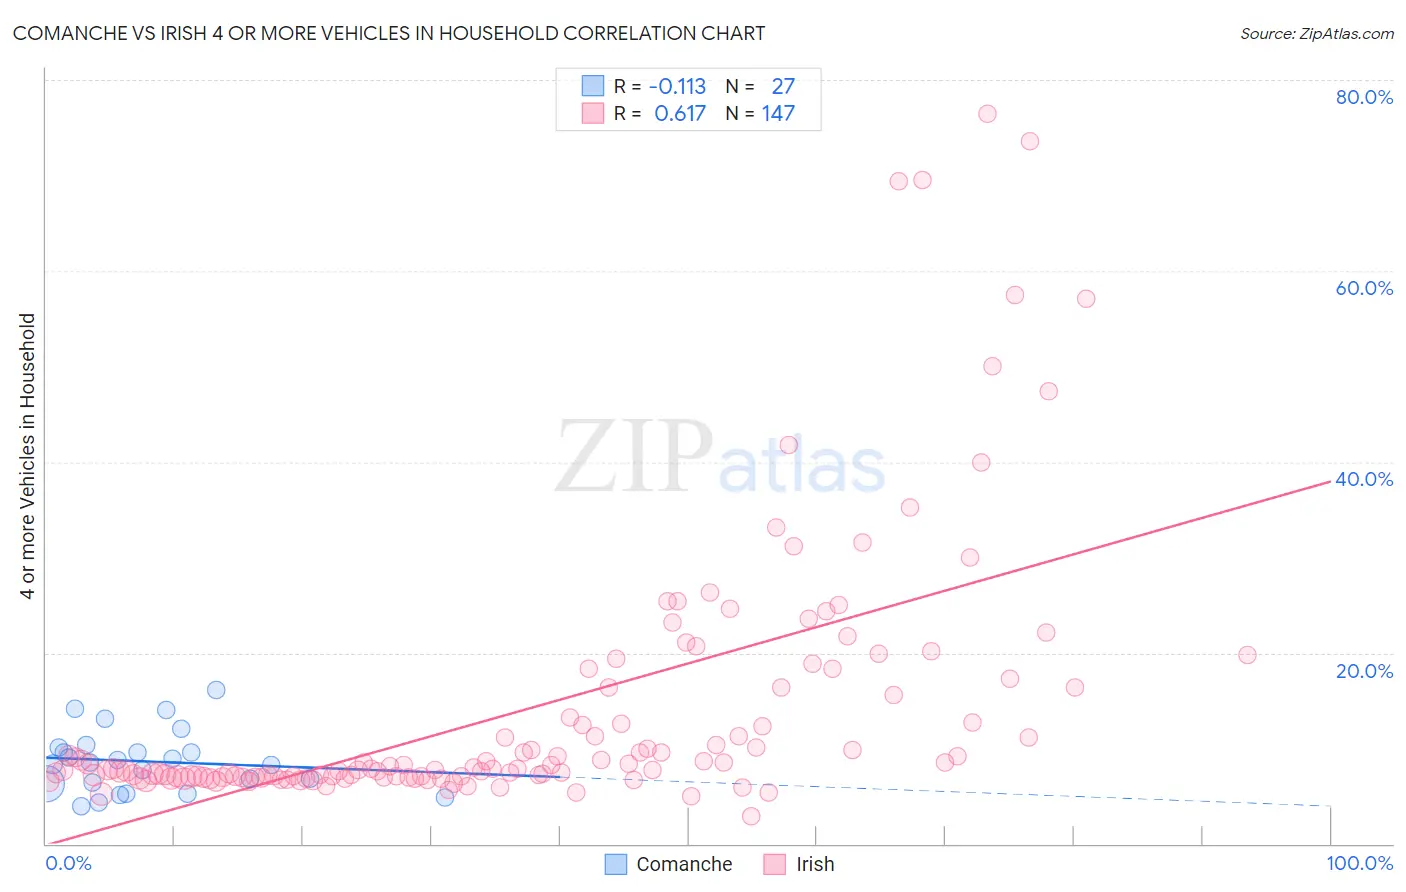
Comanche vs Irish 4 or more Vehicles in Household Correlation Chart
The statistical analysis conducted on geographies consisting of 109,674,295 people shows a poor negative correlation between the proportion of Comanche and percentage of households with 4 or more vehicles available in the United States with a correlation coefficient (R) of -0.113 and weighted average of 6.8%. Similarly, the statistical analysis conducted on geographies consisting of 576,295,994 people shows a significant positive correlation between the proportion of Irish and percentage of households with 4 or more vehicles available in the United States with a correlation coefficient (R) of 0.617 and weighted average of 7.1%, a difference of 3.9%.
4 or more Vehicles in Household Correlation Summary
| Measurement | Comanche | Irish |
| Minimum | 4.0% | 2.8% |
| Maximum | 16.1% | 76.5% |
| Range | 12.1% | 73.6% |
| Mean | 8.6% | 14.2% |
| Median | 8.5% | 7.9% |
| Interquartile 25% (IQ1) | 6.2% | 7.0% |
| Interquartile 75% (IQ3) | 10.1% | 16.4% |
| Interquartile Range (IQR) | 3.9% | 9.4% |
| Standard Deviation (Sample) | 3.2% | 14.0% |
| Standard Deviation (Population) | 3.1% | 14.0% |
Similar Demographics by 4 or more Vehicles in Household
Demographics Similar to Comanche by 4 or more Vehicles in Household
In terms of 4 or more vehicles in household, the demographic groups most similar to Comanche are Immigrants from Germany (6.8%, a difference of 0.060%), Immigrants from Nicaragua (6.8%, a difference of 0.060%), Immigrants (6.8%, a difference of 0.13%), Immigrants from Asia (6.8%, a difference of 0.23%), and Austrian (6.8%, a difference of 0.32%).
| Demographics | Rating | Rank | 4 or more Vehicles in Household |
| Canadians | 96.4 /100 | #113 | Exceptional 6.9% |
| Bolivians | 96.3 /100 | #114 | Exceptional 6.8% |
| Tlingit-Haida | 96.2 /100 | #115 | Exceptional 6.8% |
| Immigrants | Guatemala | 95.8 /100 | #116 | Exceptional 6.8% |
| Burmese | 95.7 /100 | #117 | Exceptional 6.8% |
| French American Indians | 95.7 /100 | #118 | Exceptional 6.8% |
| Costa Ricans | 95.5 /100 | #119 | Exceptional 6.8% |
| Comanche | 94.8 /100 | #120 | Exceptional 6.8% |
| Immigrants | Germany | 94.7 /100 | #121 | Exceptional 6.8% |
| Immigrants | Nicaragua | 94.7 /100 | #122 | Exceptional 6.8% |
| Immigrants | Immigrants | 94.6 /100 | #123 | Exceptional 6.8% |
| Immigrants | Asia | 94.4 /100 | #124 | Exceptional 6.8% |
| Austrians | 94.1 /100 | #125 | Exceptional 6.8% |
| Belgians | 94.1 /100 | #126 | Exceptional 6.8% |
| Immigrants | Korea | 93.8 /100 | #127 | Exceptional 6.8% |
Demographics Similar to Irish by 4 or more Vehicles in Household
In terms of 4 or more vehicles in household, the demographic groups most similar to Irish are Celtic (7.1%, a difference of 0.42%), Seminole (7.0%, a difference of 0.44%), Taiwanese (7.0%, a difference of 0.52%), Pakistani (7.0%, a difference of 0.59%), and Asian (7.0%, a difference of 0.66%).
| Demographics | Rating | Rank | 4 or more Vehicles in Household |
| Assyrians/Chaldeans/Syriacs | 99.4 /100 | #91 | Exceptional 7.2% |
| Immigrants | Latin America | 99.4 /100 | #92 | Exceptional 7.1% |
| Immigrants | Afghanistan | 99.3 /100 | #93 | Exceptional 7.1% |
| Dutch West Indians | 99.3 /100 | #94 | Exceptional 7.1% |
| Czechoslovakians | 99.3 /100 | #95 | Exceptional 7.1% |
| Central Americans | 99.3 /100 | #96 | Exceptional 7.1% |
| Celtics | 99.1 /100 | #97 | Exceptional 7.1% |
| Irish | 99.0 /100 | #98 | Exceptional 7.1% |
| Seminole | 98.8 /100 | #99 | Exceptional 7.0% |
| Taiwanese | 98.7 /100 | #100 | Exceptional 7.0% |
| Pakistanis | 98.7 /100 | #101 | Exceptional 7.0% |
| Asians | 98.6 /100 | #102 | Exceptional 7.0% |
| Blackfeet | 98.6 /100 | #103 | Exceptional 7.0% |
| Hmong | 98.3 /100 | #104 | Exceptional 7.0% |
| German Russians | 98.3 /100 | #105 | Exceptional 7.0% |