Cherokee vs Irish 4 or more Vehicles in Household
COMPARE
Cherokee
Irish
4 or more Vehicles in Household
4 or more Vehicles in Household Comparison
Cherokee
Irish
7.7%
4 OR MORE VEHICLES IN HOUSEHOLD
100.0/ 100
METRIC RATING
49th/ 347
METRIC RANK
7.1%
4 OR MORE VEHICLES IN HOUSEHOLD
99.0/ 100
METRIC RATING
98th/ 347
METRIC RANK
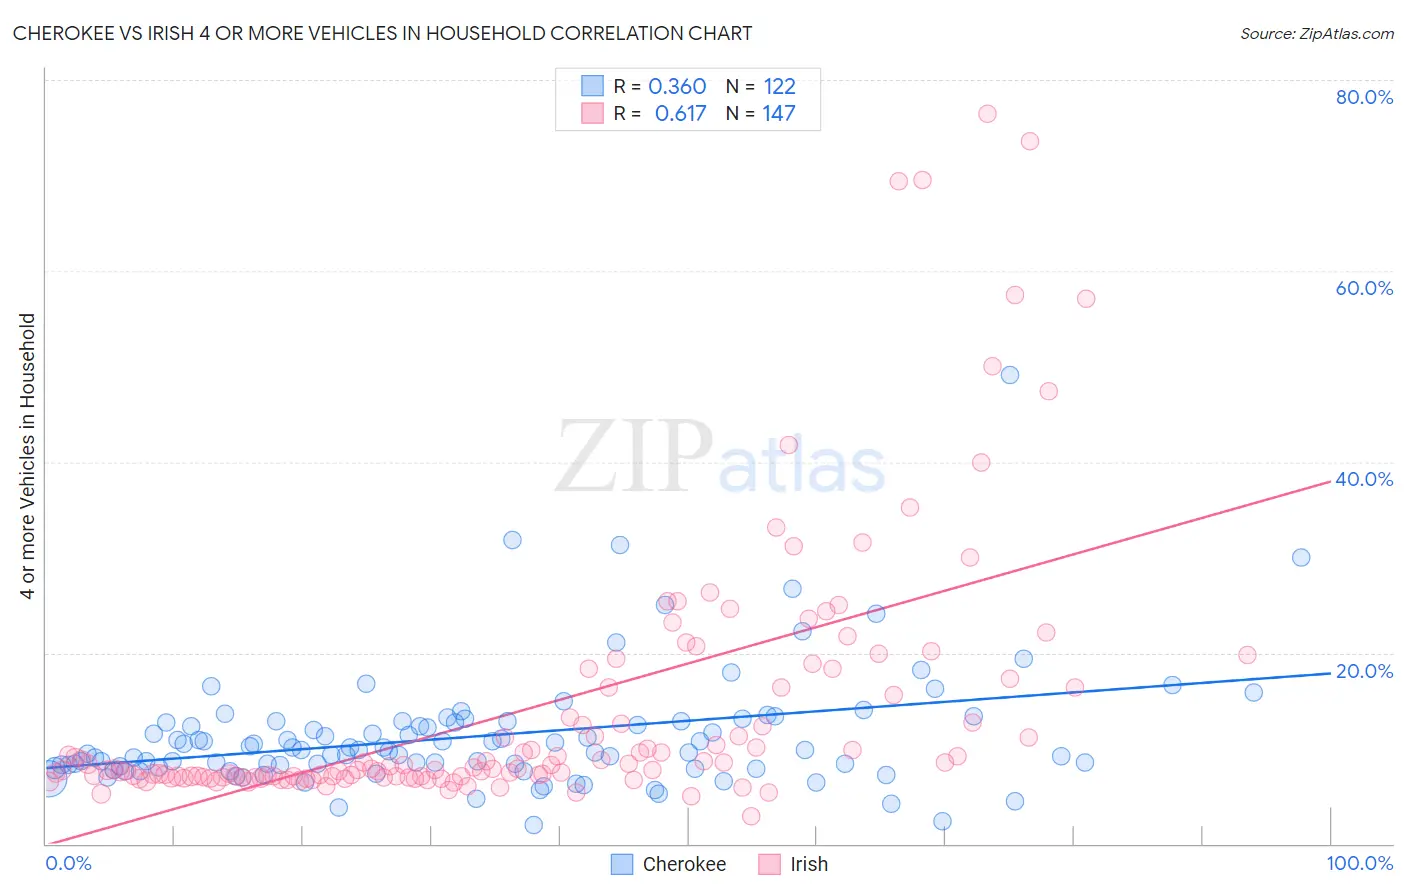
Cherokee vs Irish 4 or more Vehicles in Household Correlation Chart
The statistical analysis conducted on geographies consisting of 491,792,764 people shows a mild positive correlation between the proportion of Cherokee and percentage of households with 4 or more vehicles available in the United States with a correlation coefficient (R) of 0.360 and weighted average of 7.7%. Similarly, the statistical analysis conducted on geographies consisting of 576,295,994 people shows a significant positive correlation between the proportion of Irish and percentage of households with 4 or more vehicles available in the United States with a correlation coefficient (R) of 0.617 and weighted average of 7.1%, a difference of 9.7%.
4 or more Vehicles in Household Correlation Summary
| Measurement | Cherokee | Irish |
| Minimum | 1.9% | 2.8% |
| Maximum | 49.1% | 76.5% |
| Range | 47.2% | 73.6% |
| Mean | 11.3% | 14.2% |
| Median | 9.8% | 7.9% |
| Interquartile 25% (IQ1) | 8.0% | 7.0% |
| Interquartile 75% (IQ3) | 12.8% | 16.4% |
| Interquartile Range (IQR) | 4.7% | 9.4% |
| Standard Deviation (Sample) | 6.3% | 14.0% |
| Standard Deviation (Population) | 6.3% | 14.0% |
Similar Demographics by 4 or more Vehicles in Household
Demographics Similar to Cherokee by 4 or more Vehicles in Household
In terms of 4 or more vehicles in household, the demographic groups most similar to Cherokee are Immigrants from El Salvador (7.7%, a difference of 0.16%), Swiss (7.8%, a difference of 0.19%), Osage (7.8%, a difference of 0.36%), Immigrants from Laos (7.7%, a difference of 0.51%), and Crow (7.8%, a difference of 0.52%).
| Demographics | Rating | Rank | 4 or more Vehicles in Household |
| Salvadorans | 100.0 /100 | #42 | Exceptional 7.8% |
| Fijians | 100.0 /100 | #43 | Exceptional 7.8% |
| Bhutanese | 100.0 /100 | #44 | Exceptional 7.8% |
| Choctaw | 100.0 /100 | #45 | Exceptional 7.8% |
| Crow | 100.0 /100 | #46 | Exceptional 7.8% |
| Osage | 100.0 /100 | #47 | Exceptional 7.8% |
| Swiss | 100.0 /100 | #48 | Exceptional 7.8% |
| Cherokee | 100.0 /100 | #49 | Exceptional 7.7% |
| Immigrants | El Salvador | 100.0 /100 | #50 | Exceptional 7.7% |
| Immigrants | Laos | 100.0 /100 | #51 | Exceptional 7.7% |
| Japanese | 100.0 /100 | #52 | Exceptional 7.7% |
| Malaysians | 100.0 /100 | #53 | Exceptional 7.7% |
| Dutch | 100.0 /100 | #54 | Exceptional 7.7% |
| Immigrants | Oceania | 100.0 /100 | #55 | Exceptional 7.6% |
| English | 100.0 /100 | #56 | Exceptional 7.6% |
Demographics Similar to Irish by 4 or more Vehicles in Household
In terms of 4 or more vehicles in household, the demographic groups most similar to Irish are Celtic (7.1%, a difference of 0.42%), Seminole (7.0%, a difference of 0.44%), Taiwanese (7.0%, a difference of 0.52%), Pakistani (7.0%, a difference of 0.59%), and Asian (7.0%, a difference of 0.66%).
| Demographics | Rating | Rank | 4 or more Vehicles in Household |
| Assyrians/Chaldeans/Syriacs | 99.4 /100 | #91 | Exceptional 7.2% |
| Immigrants | Latin America | 99.4 /100 | #92 | Exceptional 7.1% |
| Immigrants | Afghanistan | 99.3 /100 | #93 | Exceptional 7.1% |
| Dutch West Indians | 99.3 /100 | #94 | Exceptional 7.1% |
| Czechoslovakians | 99.3 /100 | #95 | Exceptional 7.1% |
| Central Americans | 99.3 /100 | #96 | Exceptional 7.1% |
| Celtics | 99.1 /100 | #97 | Exceptional 7.1% |
| Irish | 99.0 /100 | #98 | Exceptional 7.1% |
| Seminole | 98.8 /100 | #99 | Exceptional 7.0% |
| Taiwanese | 98.7 /100 | #100 | Exceptional 7.0% |
| Pakistanis | 98.7 /100 | #101 | Exceptional 7.0% |
| Asians | 98.6 /100 | #102 | Exceptional 7.0% |
| Blackfeet | 98.6 /100 | #103 | Exceptional 7.0% |
| Hmong | 98.3 /100 | #104 | Exceptional 7.0% |
| German Russians | 98.3 /100 | #105 | Exceptional 7.0% |