Comanche vs Chippewa Married-couple Households
COMPARE
Comanche
Chippewa
Married-couple Households
Married-couple Households Comparison
Comanche
Chippewa
44.5%
MARRIED-COUPLE HOUSEHOLDS
1.2/ 100
METRIC RATING
237th/ 347
METRIC RANK
42.1%
MARRIED-COUPLE HOUSEHOLDS
0.0/ 100
METRIC RATING
287th/ 347
METRIC RANK
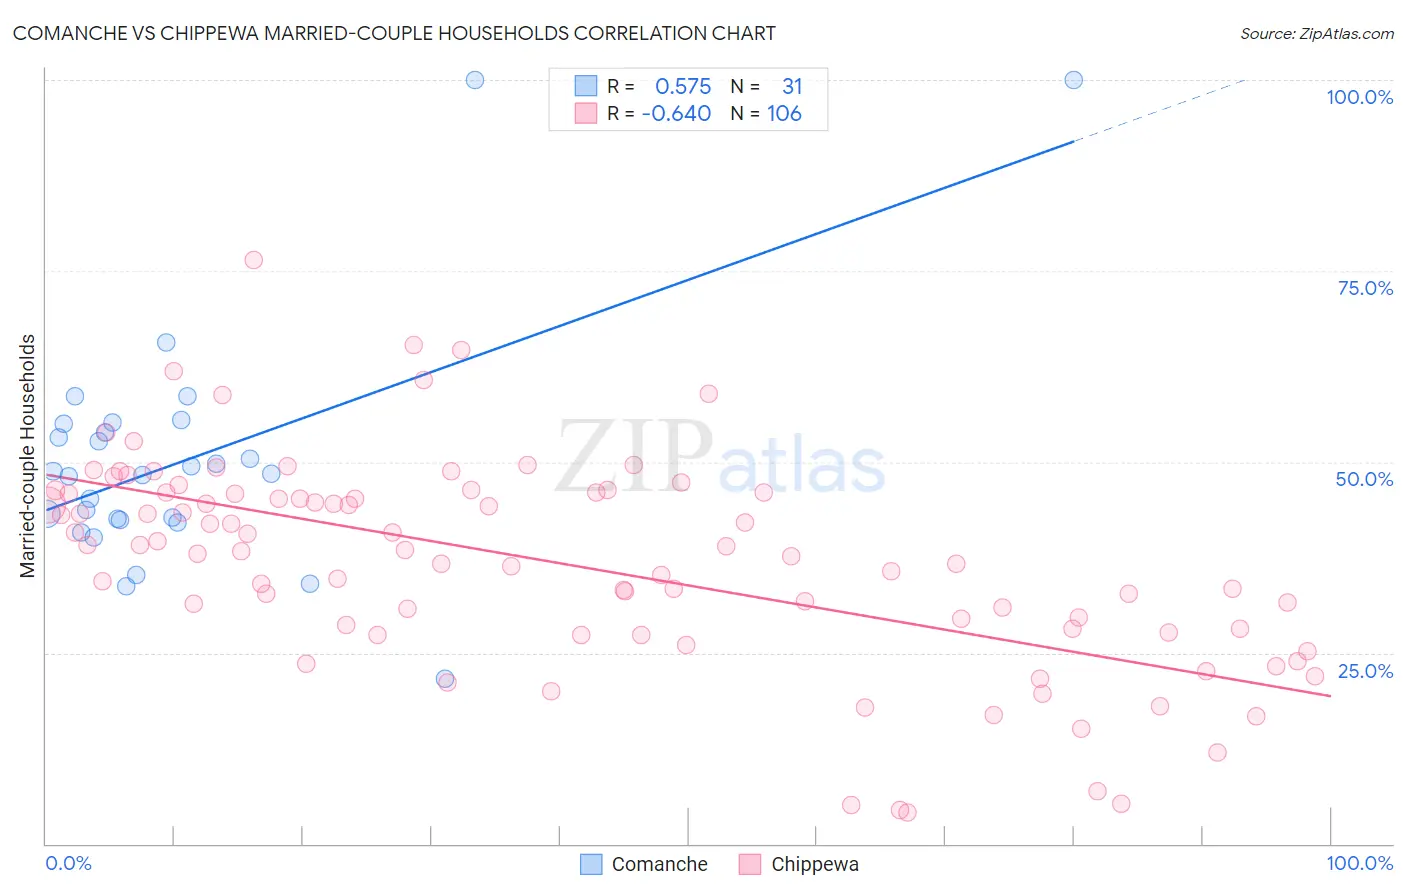
Comanche vs Chippewa Married-couple Households Correlation Chart
The statistical analysis conducted on geographies consisting of 109,768,112 people shows a substantial positive correlation between the proportion of Comanche and percentage of married-couple family households in the United States with a correlation coefficient (R) of 0.575 and weighted average of 44.5%. Similarly, the statistical analysis conducted on geographies consisting of 214,993,605 people shows a significant negative correlation between the proportion of Chippewa and percentage of married-couple family households in the United States with a correlation coefficient (R) of -0.640 and weighted average of 42.1%, a difference of 5.6%.
Married-couple Households Correlation Summary
| Measurement | Comanche | Chippewa |
| Minimum | 21.6% | 4.0% |
| Maximum | 100.0% | 76.5% |
| Range | 78.4% | 72.5% |
| Mean | 50.3% | 36.8% |
| Median | 48.4% | 38.4% |
| Interquartile 25% (IQ1) | 42.4% | 28.2% |
| Interquartile 75% (IQ3) | 55.0% | 45.9% |
| Interquartile Range (IQR) | 12.6% | 17.7% |
| Standard Deviation (Sample) | 15.9% | 13.8% |
| Standard Deviation (Population) | 15.6% | 13.7% |
Similar Demographics by Married-couple Households
Demographics Similar to Comanche by Married-couple Households
In terms of married-couple households, the demographic groups most similar to Comanche are Yaqui (44.5%, a difference of 0.030%), Immigrants from Nicaragua (44.5%, a difference of 0.040%), Immigrants from Uruguay (44.5%, a difference of 0.050%), Spanish American (44.5%, a difference of 0.070%), and Immigrants from Panama (44.6%, a difference of 0.11%).
| Demographics | Rating | Rank | Married-couple Households |
| Soviet Union | 1.6 /100 | #230 | Tragic 44.6% |
| Houma | 1.5 /100 | #231 | Tragic 44.6% |
| Marshallese | 1.5 /100 | #232 | Tragic 44.6% |
| Immigrants | Uganda | 1.5 /100 | #233 | Tragic 44.6% |
| Immigrants | Panama | 1.3 /100 | #234 | Tragic 44.6% |
| Immigrants | Nicaragua | 1.2 /100 | #235 | Tragic 44.5% |
| Yaqui | 1.2 /100 | #236 | Tragic 44.5% |
| Comanche | 1.2 /100 | #237 | Tragic 44.5% |
| Immigrants | Uruguay | 1.1 /100 | #238 | Tragic 44.5% |
| Spanish Americans | 1.1 /100 | #239 | Tragic 44.5% |
| Ute | 1.0 /100 | #240 | Tragic 44.4% |
| Immigrants | Bosnia and Herzegovina | 1.0 /100 | #241 | Tragic 44.4% |
| Immigrants | Albania | 1.0 /100 | #242 | Tragic 44.4% |
| Immigrants | Saudi Arabia | 0.9 /100 | #243 | Tragic 44.4% |
| Immigrants | Armenia | 0.7 /100 | #244 | Tragic 44.3% |
Demographics Similar to Chippewa by Married-couple Households
In terms of married-couple households, the demographic groups most similar to Chippewa are Immigrants from Eritrea (42.1%, a difference of 0.080%), Sudanese (42.1%, a difference of 0.14%), Honduran (42.1%, a difference of 0.19%), Paiute (42.1%, a difference of 0.20%), and Belizean (42.2%, a difference of 0.24%).
| Demographics | Rating | Rank | Married-couple Households |
| Immigrants | Ecuador | 0.0 /100 | #280 | Tragic 42.9% |
| Immigrants | Guatemala | 0.0 /100 | #281 | Tragic 42.8% |
| Bermudans | 0.0 /100 | #282 | Tragic 42.4% |
| Inupiat | 0.0 /100 | #283 | Tragic 42.4% |
| Cheyenne | 0.0 /100 | #284 | Tragic 42.3% |
| Ghanaians | 0.0 /100 | #285 | Tragic 42.2% |
| Belizeans | 0.0 /100 | #286 | Tragic 42.2% |
| Chippewa | 0.0 /100 | #287 | Tragic 42.1% |
| Immigrants | Eritrea | 0.0 /100 | #288 | Tragic 42.1% |
| Sudanese | 0.0 /100 | #289 | Tragic 42.1% |
| Hondurans | 0.0 /100 | #290 | Tragic 42.1% |
| Paiute | 0.0 /100 | #291 | Tragic 42.1% |
| Indonesians | 0.0 /100 | #292 | Tragic 42.0% |
| Menominee | 0.0 /100 | #293 | Tragic 42.0% |
| Immigrants | Yemen | 0.0 /100 | #294 | Tragic 42.0% |