Chippewa vs Immigrants from Indonesia 12th Grade, No Diploma
COMPARE
Chippewa
Immigrants from Indonesia
12th Grade, No Diploma
12th Grade, No Diploma Comparison
Chippewa
Immigrants from Indonesia
91.5%
12TH GRADE, NO DIPLOMA
78.8/ 100
METRIC RATING
151st/ 347
METRIC RANK
91.2%
12TH GRADE, NO DIPLOMA
54.9/ 100
METRIC RATING
169th/ 347
METRIC RANK
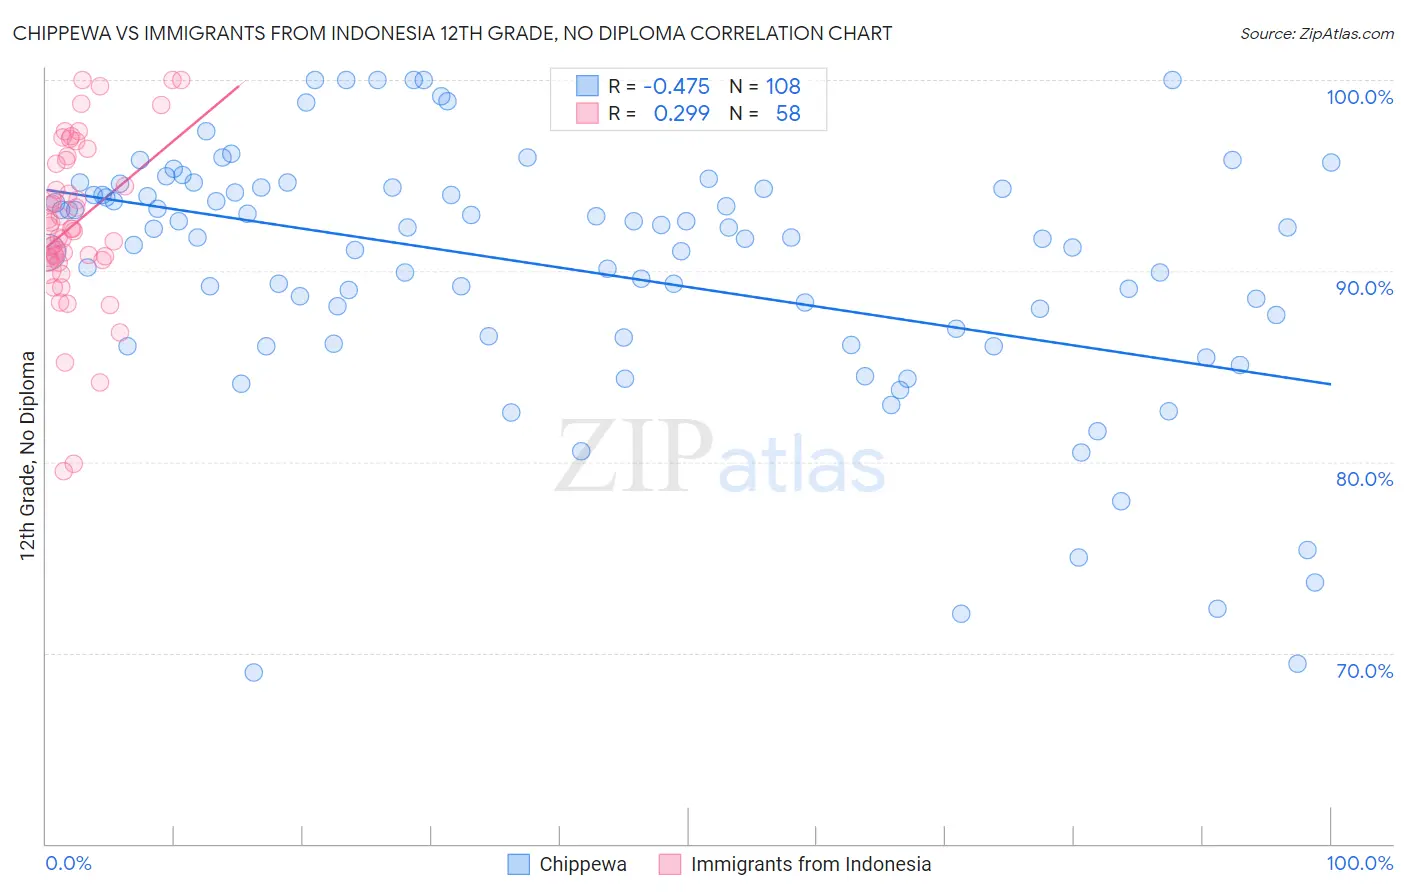
Chippewa vs Immigrants from Indonesia 12th Grade, No Diploma Correlation Chart
The statistical analysis conducted on geographies consisting of 215,068,347 people shows a moderate negative correlation between the proportion of Chippewa and percentage of population with at least 12th grade (no diploma) education in the United States with a correlation coefficient (R) of -0.475 and weighted average of 91.5%. Similarly, the statistical analysis conducted on geographies consisting of 215,765,946 people shows a weak positive correlation between the proportion of Immigrants from Indonesia and percentage of population with at least 12th grade (no diploma) education in the United States with a correlation coefficient (R) of 0.299 and weighted average of 91.2%, a difference of 0.34%.
12th Grade, No Diploma Correlation Summary
| Measurement | Chippewa | Immigrants from Indonesia |
| Minimum | 69.0% | 79.5% |
| Maximum | 100.0% | 100.0% |
| Range | 31.0% | 20.5% |
| Mean | 90.1% | 92.5% |
| Median | 91.8% | 92.2% |
| Interquartile 25% (IQ1) | 86.5% | 90.6% |
| Interquartile 75% (IQ3) | 94.3% | 95.8% |
| Interquartile Range (IQR) | 7.8% | 5.3% |
| Standard Deviation (Sample) | 6.7% | 4.4% |
| Standard Deviation (Population) | 6.6% | 4.3% |
Demographics Similar to Chippewa and Immigrants from Indonesia by 12th Grade, No Diploma
In terms of 12th grade, no diploma, the demographic groups most similar to Chippewa are Paraguayan (91.5%, a difference of 0.0%), Kenyan (91.5%, a difference of 0.030%), Iraqi (91.5%, a difference of 0.060%), Immigrants from Kenya (91.5%, a difference of 0.080%), and Immigrants from Iraq (91.4%, a difference of 0.10%). Similarly, the demographic groups most similar to Immigrants from Indonesia are Cree (91.2%, a difference of 0.030%), Delaware (91.2%, a difference of 0.030%), Alsatian (91.3%, a difference of 0.040%), Hmong (91.3%, a difference of 0.040%), and Immigrants from Malaysia (91.3%, a difference of 0.040%).
| Demographics | Rating | Rank | 12th Grade, No Diploma |
| Paraguayans | 78.9 /100 | #150 | Good 91.5% |
| Chippewa | 78.8 /100 | #151 | Good 91.5% |
| Kenyans | 77.4 /100 | #152 | Good 91.5% |
| Iraqis | 75.3 /100 | #153 | Good 91.5% |
| Immigrants | Kenya | 73.9 /100 | #154 | Good 91.5% |
| Immigrants | Iraq | 73.0 /100 | #155 | Good 91.4% |
| Asians | 71.9 /100 | #156 | Good 91.4% |
| Immigrants | Pakistan | 70.7 /100 | #157 | Good 91.4% |
| Immigrants | Northern Africa | 66.2 /100 | #158 | Good 91.4% |
| Laotians | 64.4 /100 | #159 | Good 91.3% |
| Immigrants | Albania | 64.1 /100 | #160 | Good 91.3% |
| Immigrants | Hong Kong | 63.8 /100 | #161 | Good 91.3% |
| Brazilians | 62.0 /100 | #162 | Good 91.3% |
| Immigrants | Asia | 61.5 /100 | #163 | Good 91.3% |
| Immigrants | China | 60.9 /100 | #164 | Good 91.3% |
| Alsatians | 58.3 /100 | #165 | Average 91.3% |
| Hmong | 58.0 /100 | #166 | Average 91.3% |
| Immigrants | Malaysia | 57.8 /100 | #167 | Average 91.3% |
| Cree | 57.0 /100 | #168 | Average 91.2% |
| Immigrants | Indonesia | 54.9 /100 | #169 | Average 91.2% |
| Delaware | 52.8 /100 | #170 | Average 91.2% |