Immigrants from Trinidad and Tobago vs Ottawa 2 or more Vehicles in Household
COMPARE
Immigrants from Trinidad and Tobago
Ottawa
2 or more Vehicles in Household
2 or more Vehicles in Household Comparison
Immigrants from Trinidad and Tobago
Ottawa
40.3%
2 OR MORE VEHICLES IN HOUSEHOLD
0.0/ 100
METRIC RATING
334th/ 347
METRIC RANK
57.9%
2 OR MORE VEHICLES IN HOUSEHOLD
99.0/ 100
METRIC RATING
93rd/ 347
METRIC RANK
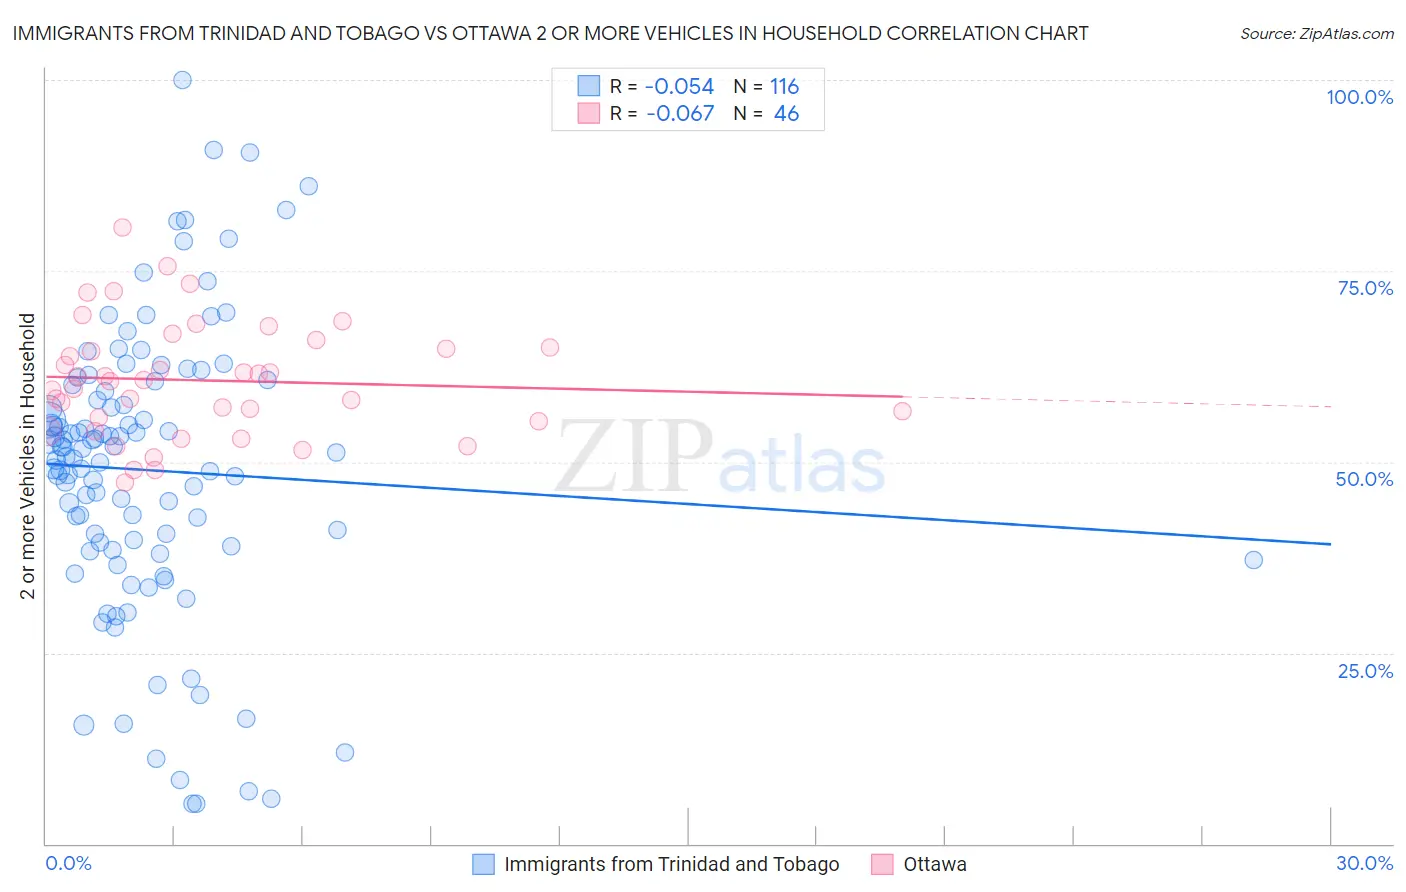
Immigrants from Trinidad and Tobago vs Ottawa 2 or more Vehicles in Household Correlation Chart
The statistical analysis conducted on geographies consisting of 223,484,323 people shows a slight negative correlation between the proportion of Immigrants from Trinidad and Tobago and percentage of households with 2 or more vehicles available in the United States with a correlation coefficient (R) of -0.054 and weighted average of 40.3%. Similarly, the statistical analysis conducted on geographies consisting of 49,944,336 people shows a slight negative correlation between the proportion of Ottawa and percentage of households with 2 or more vehicles available in the United States with a correlation coefficient (R) of -0.067 and weighted average of 57.9%, a difference of 43.7%.
2 or more Vehicles in Household Correlation Summary
| Measurement | Immigrants from Trinidad and Tobago | Ottawa |
| Minimum | 5.2% | 47.2% |
| Maximum | 100.0% | 80.8% |
| Range | 94.8% | 33.5% |
| Mean | 48.9% | 60.7% |
| Median | 50.9% | 60.6% |
| Interquartile 25% (IQ1) | 38.7% | 55.3% |
| Interquartile 75% (IQ3) | 59.7% | 65.0% |
| Interquartile Range (IQR) | 20.9% | 9.7% |
| Standard Deviation (Sample) | 18.9% | 7.5% |
| Standard Deviation (Population) | 18.9% | 7.4% |
Similar Demographics by 2 or more Vehicles in Household
Demographics Similar to Immigrants from Trinidad and Tobago by 2 or more Vehicles in Household
In terms of 2 or more vehicles in household, the demographic groups most similar to Immigrants from Trinidad and Tobago are Immigrants from Ecuador (40.5%, a difference of 0.58%), Trinidadian and Tobagonian (40.9%, a difference of 1.5%), West Indian (41.3%, a difference of 2.5%), Immigrants from Dominica (41.6%, a difference of 3.4%), and Immigrants from Bangladesh (38.8%, a difference of 3.9%).
| Demographics | Rating | Rank | 2 or more Vehicles in Household |
| Immigrants | Yemen | 0.0 /100 | #327 | Tragic 42.8% |
| Inupiat | 0.0 /100 | #328 | Tragic 42.6% |
| Ecuadorians | 0.0 /100 | #329 | Tragic 42.0% |
| Immigrants | Dominica | 0.0 /100 | #330 | Tragic 41.6% |
| West Indians | 0.0 /100 | #331 | Tragic 41.3% |
| Trinidadians and Tobagonians | 0.0 /100 | #332 | Tragic 40.9% |
| Immigrants | Ecuador | 0.0 /100 | #333 | Tragic 40.5% |
| Immigrants | Trinidad and Tobago | 0.0 /100 | #334 | Tragic 40.3% |
| Immigrants | Bangladesh | 0.0 /100 | #335 | Tragic 38.8% |
| Vietnamese | 0.0 /100 | #336 | Tragic 38.5% |
| Barbadians | 0.0 /100 | #337 | Tragic 38.3% |
| Immigrants | Uzbekistan | 0.0 /100 | #338 | Tragic 37.9% |
| Immigrants | Barbados | 0.0 /100 | #339 | Tragic 35.8% |
| British West Indians | 0.0 /100 | #340 | Tragic 35.4% |
| Guyanese | 0.0 /100 | #341 | Tragic 35.4% |
Demographics Similar to Ottawa by 2 or more Vehicles in Household
In terms of 2 or more vehicles in household, the demographic groups most similar to Ottawa are Shoshone (57.9%, a difference of 0.0%), Pakistani (57.9%, a difference of 0.030%), Immigrants from Germany (57.9%, a difference of 0.060%), Hispanic or Latino (57.9%, a difference of 0.060%), and Filipino (57.8%, a difference of 0.060%).
| Demographics | Rating | Rank | 2 or more Vehicles in Household |
| Potawatomi | 99.1 /100 | #86 | Exceptional 58.0% |
| Thais | 99.1 /100 | #87 | Exceptional 57.9% |
| Immigrants | Iran | 99.1 /100 | #88 | Exceptional 57.9% |
| Immigrants | Germany | 99.0 /100 | #89 | Exceptional 57.9% |
| Hispanics or Latinos | 99.0 /100 | #90 | Exceptional 57.9% |
| Pakistanis | 99.0 /100 | #91 | Exceptional 57.9% |
| Shoshone | 99.0 /100 | #92 | Exceptional 57.9% |
| Ottawa | 99.0 /100 | #93 | Exceptional 57.9% |
| Filipinos | 98.9 /100 | #94 | Exceptional 57.8% |
| Hmong | 98.9 /100 | #95 | Exceptional 57.8% |
| Burmese | 98.8 /100 | #96 | Exceptional 57.8% |
| Slavs | 98.8 /100 | #97 | Exceptional 57.8% |
| Palestinians | 98.6 /100 | #98 | Exceptional 57.7% |
| Cajuns | 98.5 /100 | #99 | Exceptional 57.7% |
| Fijians | 98.4 /100 | #100 | Exceptional 57.6% |