Chickasaw vs Assyrian/Chaldean/Syriac Ambulatory Disability
COMPARE
Chickasaw
Assyrian/Chaldean/Syriac
Ambulatory Disability
Ambulatory Disability Comparison
Chickasaw
Assyrians/Chaldeans/Syriacs
8.0%
AMBULATORY DISABILITY
0.0/ 100
METRIC RATING
335th/ 347
METRIC RANK
6.4%
AMBULATORY DISABILITY
2.4/ 100
METRIC RATING
232nd/ 347
METRIC RANK
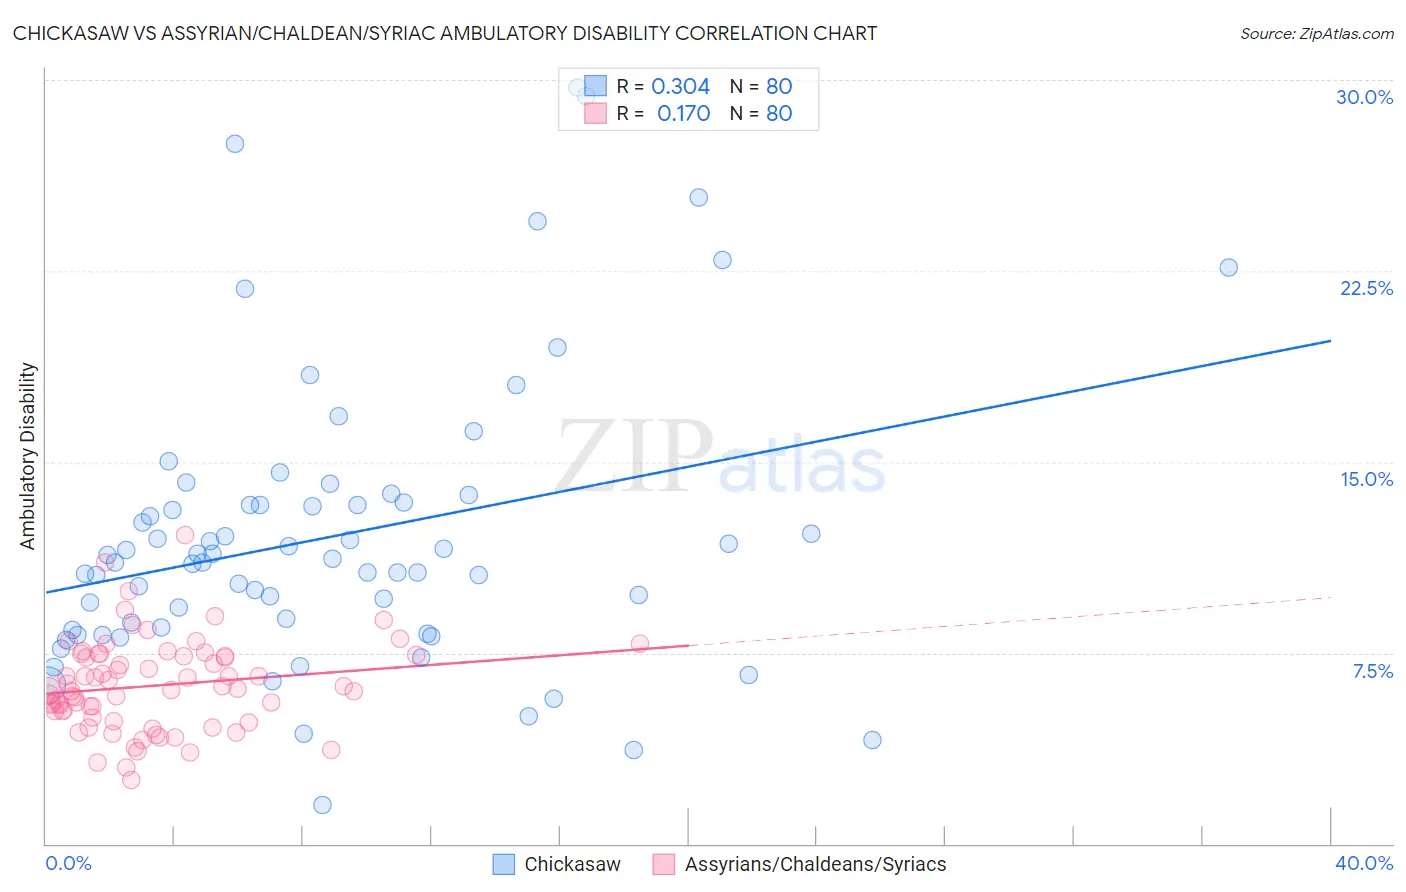
Chickasaw vs Assyrian/Chaldean/Syriac Ambulatory Disability Correlation Chart
The statistical analysis conducted on geographies consisting of 147,679,473 people shows a mild positive correlation between the proportion of Chickasaw and percentage of population with ambulatory disability in the United States with a correlation coefficient (R) of 0.304 and weighted average of 8.0%. Similarly, the statistical analysis conducted on geographies consisting of 110,309,207 people shows a poor positive correlation between the proportion of Assyrians/Chaldeans/Syriacs and percentage of population with ambulatory disability in the United States with a correlation coefficient (R) of 0.170 and weighted average of 6.4%, a difference of 25.2%.
Ambulatory Disability Correlation Summary
| Measurement | Chickasaw | Assyrian/Chaldean/Syriac |
| Minimum | 1.5% | 2.5% |
| Maximum | 29.7% | 12.1% |
| Range | 28.2% | 9.7% |
| Mean | 12.1% | 6.2% |
| Median | 11.1% | 6.1% |
| Interquartile 25% (IQ1) | 8.4% | 5.1% |
| Interquartile 75% (IQ3) | 13.4% | 7.4% |
| Interquartile Range (IQR) | 4.9% | 2.3% |
| Standard Deviation (Sample) | 5.6% | 1.8% |
| Standard Deviation (Population) | 5.6% | 1.8% |
Similar Demographics by Ambulatory Disability
Demographics Similar to Chickasaw by Ambulatory Disability
In terms of ambulatory disability, the demographic groups most similar to Chickasaw are Seminole (8.0%, a difference of 0.070%), Yuman (7.9%, a difference of 1.1%), Dutch West Indian (8.2%, a difference of 1.7%), Cherokee (7.9%, a difference of 2.1%), and Colville (8.2%, a difference of 2.3%).
| Demographics | Rating | Rank | Ambulatory Disability |
| Hopi | 0.0 /100 | #328 | Tragic 7.6% |
| Pueblo | 0.0 /100 | #329 | Tragic 7.6% |
| Paiute | 0.0 /100 | #330 | Tragic 7.7% |
| Cajuns | 0.0 /100 | #331 | Tragic 7.8% |
| Menominee | 0.0 /100 | #332 | Tragic 7.8% |
| Cherokee | 0.0 /100 | #333 | Tragic 7.9% |
| Yuman | 0.0 /100 | #334 | Tragic 7.9% |
| Chickasaw | 0.0 /100 | #335 | Tragic 8.0% |
| Seminole | 0.0 /100 | #336 | Tragic 8.0% |
| Dutch West Indians | 0.0 /100 | #337 | Tragic 8.2% |
| Colville | 0.0 /100 | #338 | Tragic 8.2% |
| Pima | 0.0 /100 | #339 | Tragic 8.2% |
| Choctaw | 0.0 /100 | #340 | Tragic 8.3% |
| Creek | 0.0 /100 | #341 | Tragic 8.5% |
| Kiowa | 0.0 /100 | #342 | Tragic 8.6% |
Demographics Similar to Assyrians/Chaldeans/Syriacs by Ambulatory Disability
In terms of ambulatory disability, the demographic groups most similar to Assyrians/Chaldeans/Syriacs are Subsaharan African (6.4%, a difference of 0.060%), Immigrants from Liberia (6.4%, a difference of 0.090%), Hispanic or Latino (6.4%, a difference of 0.12%), Dutch (6.4%, a difference of 0.27%), and Panamanian (6.4%, a difference of 0.33%).
| Demographics | Rating | Rank | Ambulatory Disability |
| Hondurans | 6.3 /100 | #225 | Tragic 6.3% |
| Slavs | 5.1 /100 | #226 | Tragic 6.4% |
| Cubans | 4.0 /100 | #227 | Tragic 6.4% |
| Portuguese | 4.0 /100 | #228 | Tragic 6.4% |
| Czechoslovakians | 3.8 /100 | #229 | Tragic 6.4% |
| Mexicans | 3.5 /100 | #230 | Tragic 6.4% |
| Panamanians | 3.1 /100 | #231 | Tragic 6.4% |
| Assyrians/Chaldeans/Syriacs | 2.4 /100 | #232 | Tragic 6.4% |
| Sub-Saharan Africans | 2.3 /100 | #233 | Tragic 6.4% |
| Immigrants | Liberia | 2.3 /100 | #234 | Tragic 6.4% |
| Hispanics or Latinos | 2.2 /100 | #235 | Tragic 6.4% |
| Dutch | 2.0 /100 | #236 | Tragic 6.4% |
| Immigrants | Germany | 1.8 /100 | #237 | Tragic 6.4% |
| Haitians | 1.8 /100 | #238 | Tragic 6.4% |
| Senegalese | 1.7 /100 | #239 | Tragic 6.4% |