Greek vs Immigrants from Cuba 4 or more Vehicles in Household
COMPARE
Greek
Immigrants from Cuba
4 or more Vehicles in Household
4 or more Vehicles in Household Comparison
Greeks
Immigrants from Cuba
6.5%
4 OR MORE VEHICLES IN HOUSEHOLD
73.6/ 100
METRIC RATING
149th/ 347
METRIC RANK
5.7%
4 OR MORE VEHICLES IN HOUSEHOLD
1.6/ 100
METRIC RATING
253rd/ 347
METRIC RANK
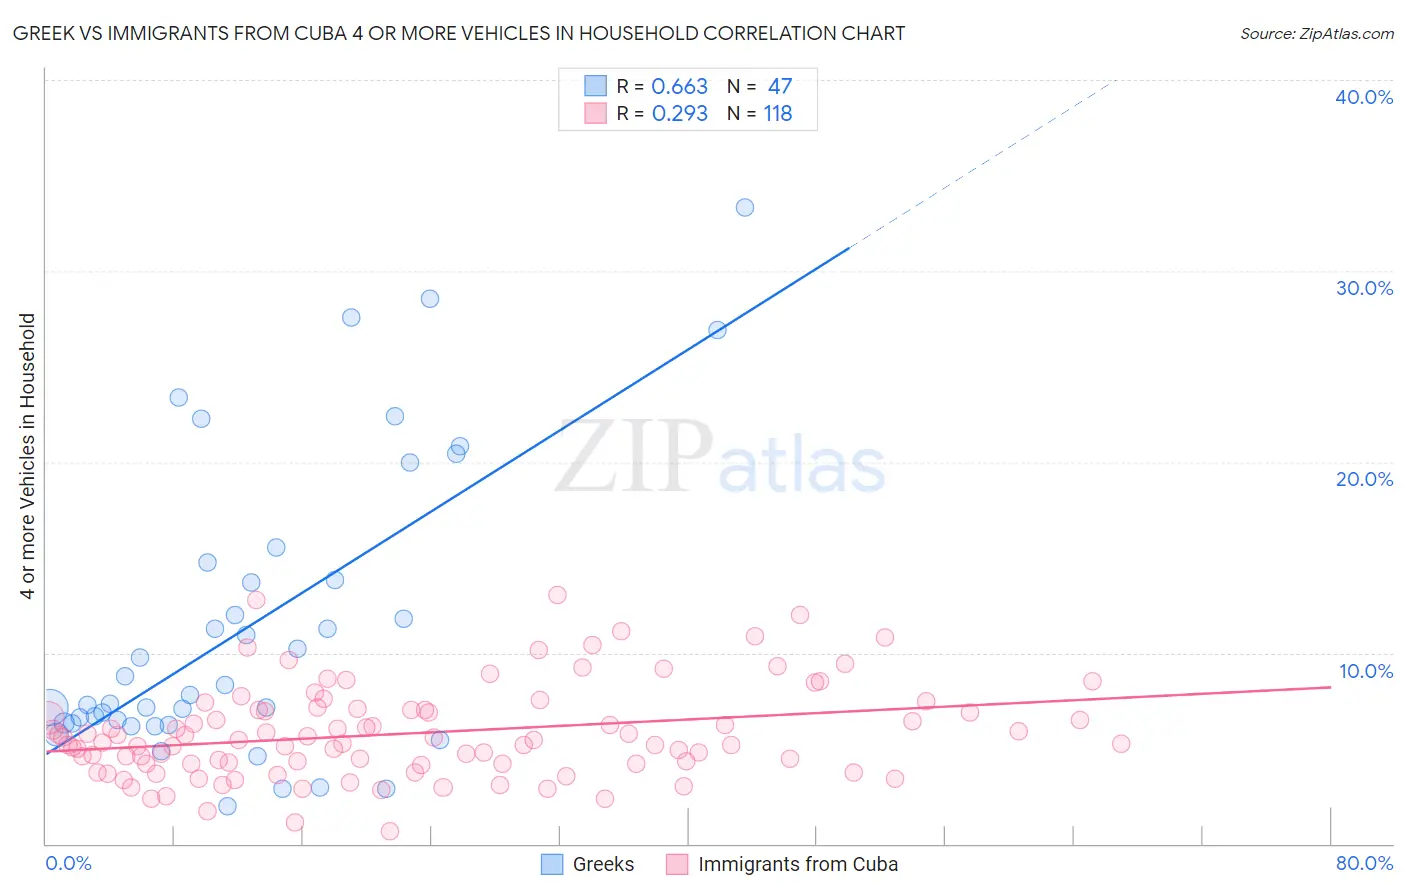
Greek vs Immigrants from Cuba 4 or more Vehicles in Household Correlation Chart
The statistical analysis conducted on geographies consisting of 480,370,844 people shows a significant positive correlation between the proportion of Greeks and percentage of households with 4 or more vehicles available in the United States with a correlation coefficient (R) of 0.663 and weighted average of 6.5%. Similarly, the statistical analysis conducted on geographies consisting of 324,547,642 people shows a weak positive correlation between the proportion of Immigrants from Cuba and percentage of households with 4 or more vehicles available in the United States with a correlation coefficient (R) of 0.293 and weighted average of 5.7%, a difference of 14.5%.
4 or more Vehicles in Household Correlation Summary
| Measurement | Greek | Immigrants from Cuba |
| Minimum | 2.0% | 0.68% |
| Maximum | 33.3% | 13.0% |
| Range | 31.4% | 12.4% |
| Mean | 11.4% | 5.8% |
| Median | 7.8% | 5.4% |
| Interquartile 25% (IQ1) | 6.3% | 4.2% |
| Interquartile 75% (IQ3) | 14.7% | 7.0% |
| Interquartile Range (IQR) | 8.4% | 2.8% |
| Standard Deviation (Sample) | 7.8% | 2.4% |
| Standard Deviation (Population) | 7.7% | 2.4% |
Similar Demographics by 4 or more Vehicles in Household
Demographics Similar to Greeks by 4 or more Vehicles in Household
In terms of 4 or more vehicles in household, the demographic groups most similar to Greeks are Immigrants from Jordan (6.5%, a difference of 0.0%), Immigrants from Iran (6.5%, a difference of 0.040%), New Zealander (6.5%, a difference of 0.040%), Immigrants from Costa Rica (6.5%, a difference of 0.090%), and Immigrants from Hong Kong (6.5%, a difference of 0.18%).
| Demographics | Rating | Rank | 4 or more Vehicles in Household |
| Immigrants | Iraq | 79.4 /100 | #142 | Good 6.5% |
| Immigrants | Canada | 78.6 /100 | #143 | Good 6.5% |
| Immigrants | North America | 78.5 /100 | #144 | Good 6.5% |
| Croatians | 77.8 /100 | #145 | Good 6.5% |
| Immigrants | Costa Rica | 74.4 /100 | #146 | Good 6.5% |
| Immigrants | Iran | 73.9 /100 | #147 | Good 6.5% |
| Immigrants | Jordan | 73.7 /100 | #148 | Good 6.5% |
| Greeks | 73.6 /100 | #149 | Good 6.5% |
| New Zealanders | 73.3 /100 | #150 | Good 6.5% |
| Immigrants | Hong Kong | 72.2 /100 | #151 | Good 6.5% |
| Yuman | 72.1 /100 | #152 | Good 6.5% |
| Immigrants | Armenia | 71.2 /100 | #153 | Good 6.5% |
| Central American Indians | 71.1 /100 | #154 | Good 6.5% |
| Iroquois | 70.4 /100 | #155 | Good 6.5% |
| Iranians | 69.9 /100 | #156 | Good 6.5% |
Demographics Similar to Immigrants from Cuba by 4 or more Vehicles in Household
In terms of 4 or more vehicles in household, the demographic groups most similar to Immigrants from Cuba are Immigrants from Panama (5.7%, a difference of 0.14%), Yup'ik (5.7%, a difference of 0.22%), Immigrants from Turkey (5.7%, a difference of 0.26%), Immigrants from Northern Africa (5.6%, a difference of 0.34%), and Immigrants from Lithuania (5.6%, a difference of 0.48%).
| Demographics | Rating | Rank | 4 or more Vehicles in Household |
| Immigrants | North Macedonia | 2.5 /100 | #246 | Tragic 5.7% |
| Immigrants | Ethiopia | 2.4 /100 | #247 | Tragic 5.7% |
| Immigrants | Eastern Africa | 2.4 /100 | #248 | Tragic 5.7% |
| Immigrants | Southern Europe | 2.3 /100 | #249 | Tragic 5.7% |
| Immigrants | Europe | 2.3 /100 | #250 | Tragic 5.7% |
| Ugandans | 2.2 /100 | #251 | Tragic 5.7% |
| Sub-Saharan Africans | 2.1 /100 | #252 | Tragic 5.7% |
| Immigrants | Cuba | 1.6 /100 | #253 | Tragic 5.7% |
| Immigrants | Panama | 1.5 /100 | #254 | Tragic 5.7% |
| Yup'ik | 1.5 /100 | #255 | Tragic 5.7% |
| Immigrants | Turkey | 1.5 /100 | #256 | Tragic 5.7% |
| Immigrants | Northern Africa | 1.4 /100 | #257 | Tragic 5.6% |
| Immigrants | Lithuania | 1.4 /100 | #258 | Tragic 5.6% |
| Immigrants | France | 1.3 /100 | #259 | Tragic 5.6% |
| Uruguayans | 1.3 /100 | #260 | Tragic 5.6% |