Celtic vs Luxembourger Disability Age 35 to 64
COMPARE
Celtic
Luxembourger
Disability Age 35 to 64
Disability Age 35 to 64 Comparison
Celtics
Luxembourgers
12.9%
DISABILITY AGE 35 TO 64
0.1/ 100
METRIC RATING
274th/ 347
METRIC RANK
10.6%
DISABILITY AGE 35 TO 64
95.5/ 100
METRIC RATING
119th/ 347
METRIC RANK
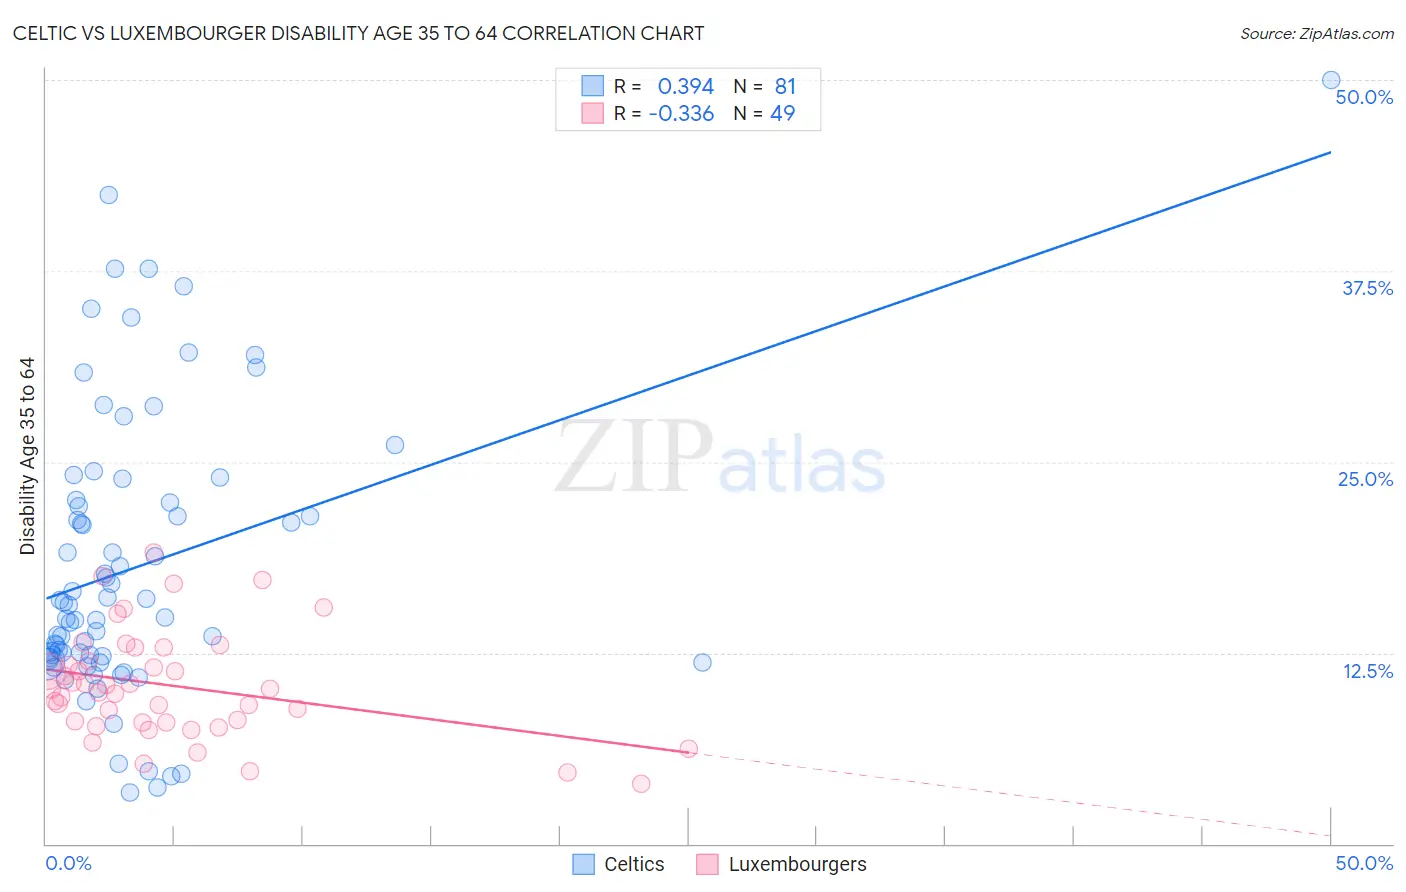
Celtic vs Luxembourger Disability Age 35 to 64 Correlation Chart
The statistical analysis conducted on geographies consisting of 168,843,567 people shows a mild positive correlation between the proportion of Celtics and percentage of population with a disability between the ages 34 and 64 in the United States with a correlation coefficient (R) of 0.394 and weighted average of 12.9%. Similarly, the statistical analysis conducted on geographies consisting of 144,643,404 people shows a mild negative correlation between the proportion of Luxembourgers and percentage of population with a disability between the ages 34 and 64 in the United States with a correlation coefficient (R) of -0.336 and weighted average of 10.6%, a difference of 21.4%.
Disability Age 35 to 64 Correlation Summary
| Measurement | Celtic | Luxembourger |
| Minimum | 3.4% | 3.9% |
| Maximum | 50.0% | 19.1% |
| Range | 46.6% | 15.1% |
| Mean | 18.2% | 10.3% |
| Median | 15.6% | 10.1% |
| Interquartile 25% (IQ1) | 12.1% | 7.9% |
| Interquartile 75% (IQ3) | 22.4% | 12.4% |
| Interquartile Range (IQR) | 10.3% | 4.4% |
| Standard Deviation (Sample) | 9.4% | 3.5% |
| Standard Deviation (Population) | 9.3% | 3.4% |
Similar Demographics by Disability Age 35 to 64
Demographics Similar to Celtics by Disability Age 35 to 64
In terms of disability age 35 to 64, the demographic groups most similar to Celtics are Pennsylvania German (12.8%, a difference of 0.030%), U.S. Virgin Islander (12.8%, a difference of 0.11%), Dominican (12.9%, a difference of 0.14%), Nepalese (12.8%, a difference of 0.23%), and Somali (12.9%, a difference of 0.26%).
| Demographics | Rating | Rank | Disability Age 35 to 64 |
| Sub-Saharan Africans | 0.2 /100 | #267 | Tragic 12.6% |
| Immigrants | Dominica | 0.2 /100 | #268 | Tragic 12.7% |
| Spanish | 0.2 /100 | #269 | Tragic 12.7% |
| French | 0.2 /100 | #270 | Tragic 12.7% |
| Nepalese | 0.1 /100 | #271 | Tragic 12.8% |
| U.S. Virgin Islanders | 0.1 /100 | #272 | Tragic 12.8% |
| Pennsylvania Germans | 0.1 /100 | #273 | Tragic 12.8% |
| Celtics | 0.1 /100 | #274 | Tragic 12.9% |
| Dominicans | 0.1 /100 | #275 | Tragic 12.9% |
| Somalis | 0.1 /100 | #276 | Tragic 12.9% |
| Immigrants | Dominican Republic | 0.1 /100 | #277 | Tragic 12.9% |
| French Canadians | 0.1 /100 | #278 | Tragic 12.9% |
| Immigrants | Micronesia | 0.1 /100 | #279 | Tragic 12.9% |
| Liberians | 0.1 /100 | #280 | Tragic 12.9% |
| Scotch-Irish | 0.1 /100 | #281 | Tragic 13.0% |
Demographics Similar to Luxembourgers by Disability Age 35 to 64
In terms of disability age 35 to 64, the demographic groups most similar to Luxembourgers are Vietnamese (10.6%, a difference of 0.020%), Immigrants from Moldova (10.6%, a difference of 0.050%), Immigrants from South Eastern Asia (10.6%, a difference of 0.14%), Romanian (10.6%, a difference of 0.19%), and Immigrants from Norway (10.6%, a difference of 0.22%).
| Demographics | Rating | Rank | Disability Age 35 to 64 |
| Assyrians/Chaldeans/Syriacs | 96.8 /100 | #112 | Exceptional 10.5% |
| Tongans | 96.6 /100 | #113 | Exceptional 10.5% |
| Immigrants | Morocco | 96.6 /100 | #114 | Exceptional 10.5% |
| Immigrants | Netherlands | 96.3 /100 | #115 | Exceptional 10.5% |
| Immigrants | Nepal | 95.9 /100 | #116 | Exceptional 10.6% |
| Immigrants | South Eastern Asia | 95.7 /100 | #117 | Exceptional 10.6% |
| Immigrants | Moldova | 95.5 /100 | #118 | Exceptional 10.6% |
| Luxembourgers | 95.5 /100 | #119 | Exceptional 10.6% |
| Vietnamese | 95.4 /100 | #120 | Exceptional 10.6% |
| Romanians | 95.0 /100 | #121 | Exceptional 10.6% |
| Immigrants | Norway | 95.0 /100 | #122 | Exceptional 10.6% |
| Maltese | 94.8 /100 | #123 | Exceptional 10.6% |
| Estonians | 94.5 /100 | #124 | Exceptional 10.6% |
| Albanians | 94.2 /100 | #125 | Exceptional 10.6% |
| Immigrants | Afghanistan | 94.1 /100 | #126 | Exceptional 10.6% |