Cape Verdean vs Marshallese Births to Unmarried Women
COMPARE
Cape Verdean
Marshallese
Births to Unmarried Women
Births to Unmarried Women Comparison
Cape Verdeans
Marshallese
41.3%
BIRTHS TO UNMARRIED WOMEN
0.0/ 100
METRIC RATING
324th/ 347
METRIC RANK
34.8%
BIRTHS TO UNMARRIED WOMEN
1.6/ 100
METRIC RATING
237th/ 347
METRIC RANK
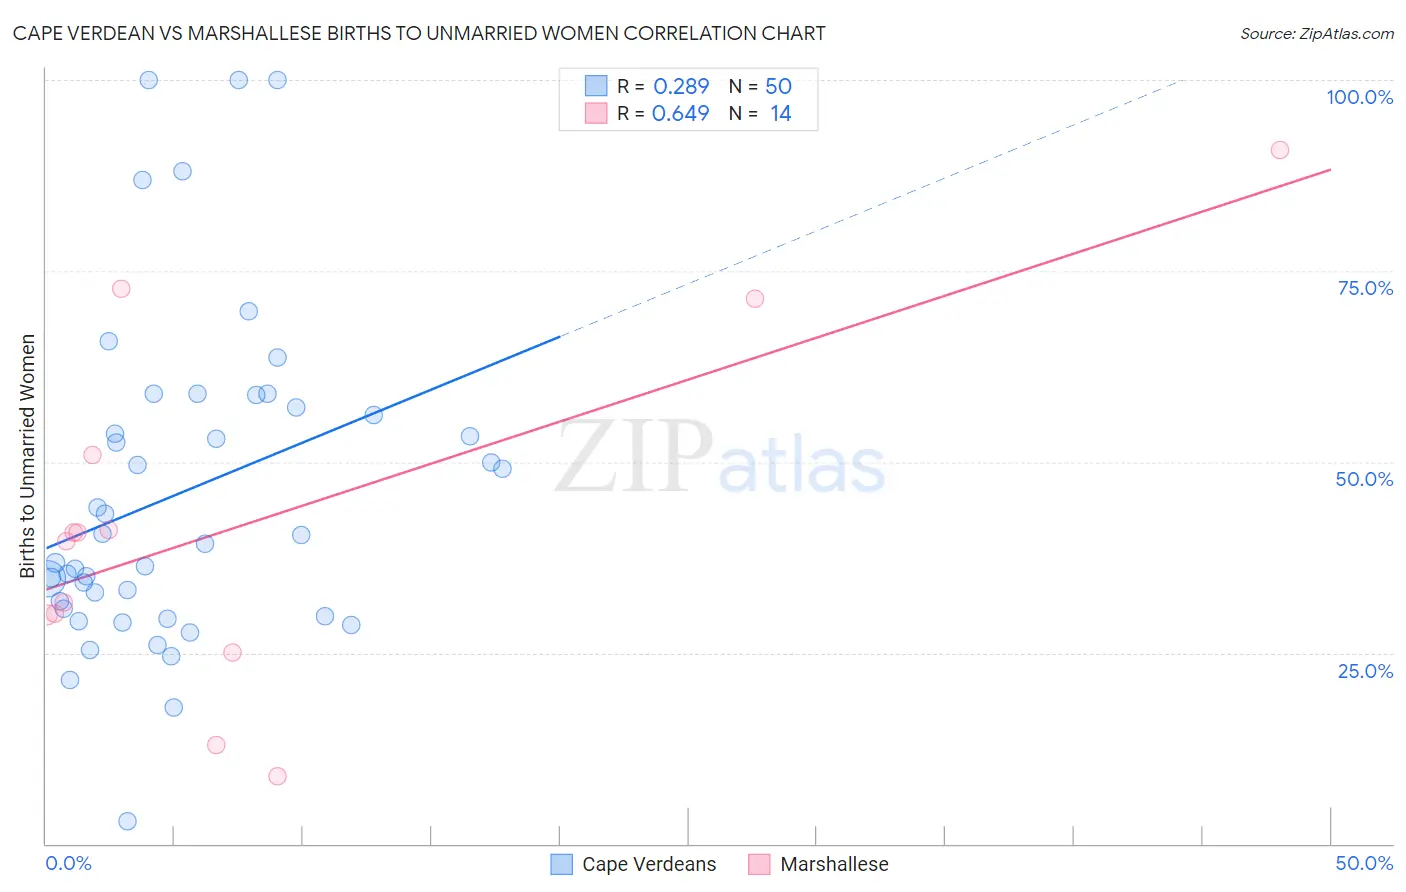
Cape Verdean vs Marshallese Births to Unmarried Women Correlation Chart
The statistical analysis conducted on geographies consisting of 104,600,290 people shows a weak positive correlation between the proportion of Cape Verdeans and percentage of births to unmarried women in the United States with a correlation coefficient (R) of 0.289 and weighted average of 41.3%. Similarly, the statistical analysis conducted on geographies consisting of 14,693,894 people shows a significant positive correlation between the proportion of Marshallese and percentage of births to unmarried women in the United States with a correlation coefficient (R) of 0.649 and weighted average of 34.8%, a difference of 18.9%.
Births to Unmarried Women Correlation Summary
| Measurement | Cape Verdean | Marshallese |
| Minimum | 3.0% | 8.9% |
| Maximum | 100.0% | 90.9% |
| Range | 97.0% | 82.0% |
| Mean | 45.9% | 41.9% |
| Median | 39.8% | 40.2% |
| Interquartile 25% (IQ1) | 30.7% | 30.0% |
| Interquartile 75% (IQ3) | 57.2% | 51.0% |
| Interquartile Range (IQR) | 26.5% | 21.0% |
| Standard Deviation (Sample) | 21.5% | 23.0% |
| Standard Deviation (Population) | 21.3% | 22.2% |
Similar Demographics by Births to Unmarried Women
Demographics Similar to Cape Verdeans by Births to Unmarried Women
In terms of births to unmarried women, the demographic groups most similar to Cape Verdeans are Cheyenne (41.3%, a difference of 0.060%), Immigrants from Cuba (41.5%, a difference of 0.33%), Sioux (41.0%, a difference of 0.80%), Cajun (41.0%, a difference of 0.87%), and Bahamian (40.8%, a difference of 1.4%).
| Demographics | Rating | Rank | Births to Unmarried Women |
| Immigrants | Dominican Republic | 0.0 /100 | #317 | Tragic 40.1% |
| Immigrants | Bahamas | 0.0 /100 | #318 | Tragic 40.1% |
| Yakama | 0.0 /100 | #319 | Tragic 40.3% |
| Crow | 0.0 /100 | #320 | Tragic 40.4% |
| Bahamians | 0.0 /100 | #321 | Tragic 40.8% |
| Cajuns | 0.0 /100 | #322 | Tragic 41.0% |
| Sioux | 0.0 /100 | #323 | Tragic 41.0% |
| Cape Verdeans | 0.0 /100 | #324 | Tragic 41.3% |
| Cheyenne | 0.0 /100 | #325 | Tragic 41.3% |
| Immigrants | Cuba | 0.0 /100 | #326 | Tragic 41.5% |
| Tsimshian | 0.0 /100 | #327 | Tragic 42.2% |
| Immigrants | Cabo Verde | 0.0 /100 | #328 | Tragic 42.2% |
| Paiute | 0.0 /100 | #329 | Tragic 42.5% |
| Chippewa | 0.0 /100 | #330 | Tragic 42.6% |
| Natives/Alaskans | 0.0 /100 | #331 | Tragic 43.0% |
Demographics Similar to Marshallese by Births to Unmarried Women
In terms of births to unmarried women, the demographic groups most similar to Marshallese are Immigrants from Cambodia (34.8%, a difference of 0.060%), Immigrants from Cameroon (34.7%, a difference of 0.070%), Sierra Leonean (34.9%, a difference of 0.28%), Immigrants from Middle Africa (34.9%, a difference of 0.53%), and Immigrants from Guyana (35.0%, a difference of 0.57%).
| Demographics | Rating | Rank | Births to Unmarried Women |
| Ghanaians | 3.1 /100 | #230 | Tragic 34.3% |
| Native Hawaiians | 2.9 /100 | #231 | Tragic 34.3% |
| French Canadians | 2.5 /100 | #232 | Tragic 34.4% |
| Bangladeshis | 2.5 /100 | #233 | Tragic 34.4% |
| Immigrants | Zaire | 2.3 /100 | #234 | Tragic 34.5% |
| Immigrants | Ghana | 2.2 /100 | #235 | Tragic 34.5% |
| Immigrants | Cameroon | 1.6 /100 | #236 | Tragic 34.7% |
| Marshallese | 1.6 /100 | #237 | Tragic 34.8% |
| Immigrants | Cambodia | 1.6 /100 | #238 | Tragic 34.8% |
| Sierra Leoneans | 1.4 /100 | #239 | Tragic 34.9% |
| Immigrants | Middle Africa | 1.2 /100 | #240 | Tragic 34.9% |
| Immigrants | Guyana | 1.2 /100 | #241 | Tragic 35.0% |
| Indonesians | 1.2 /100 | #242 | Tragic 35.0% |
| Japanese | 0.9 /100 | #243 | Tragic 35.2% |
| Guyanese | 0.9 /100 | #244 | Tragic 35.2% |